With the release of Amazon OpenSearch Service 2.5, you can create maps with multiple layers to visualize your geographical data. You can build each layer from a different index pattern to separate data sources. Organizing the map in layers makes it more straightforward to visualize, view, and analyze geographical data. The layering also helps fetch data from various sources, view different data at different zoom levels, and continuously refresh data for a real-time dataset. Additionally, in OpenSearch 2.6, you can add multi-layer maps to dashboard panes within OpenSearch Dashboards, which makes it more straightforward to analyze your geospatial data in the context of other visualizations. OpenSearch Service provisions all the resources for your OpenSearch cluster so you can focus on building the business value through maps and other features of OpenSearch rather than spending time managing your deployment.
In this post, we show how to use multi-layer maps in OpenSearch Service.
Solution overview
The multi-layer map helps users visualize data and gain insights using specific layers and zoom levels to help emphasize key messages. For our use case, we use multi-layer maps to support an example real-estate application. Your index will have fields such as location, address, availability, number of bedrooms, price, and more. Initially, we develop a map with state boundaries with aggregated data for an overview. As the user zooms in, they’ll see city boundaries and postal codes. As the user continues to zoom, they’ll see each house with information like the price, number of bedrooms, and so on. You will build various data layers from different data sources to accomplish this task. You can also add filter queries; for example, to only show properties that are available.
Prerequisites
Complete the following prerequisite steps to configure the sample data:
- Create an OpenSearch Service domain (version 2.7 or higher).
- Download the file bulk_request_realestate.txt.
- Copy and paste the entire contents of the downloaded file into the OpenSearch Dashboards console.
- Run the commands.
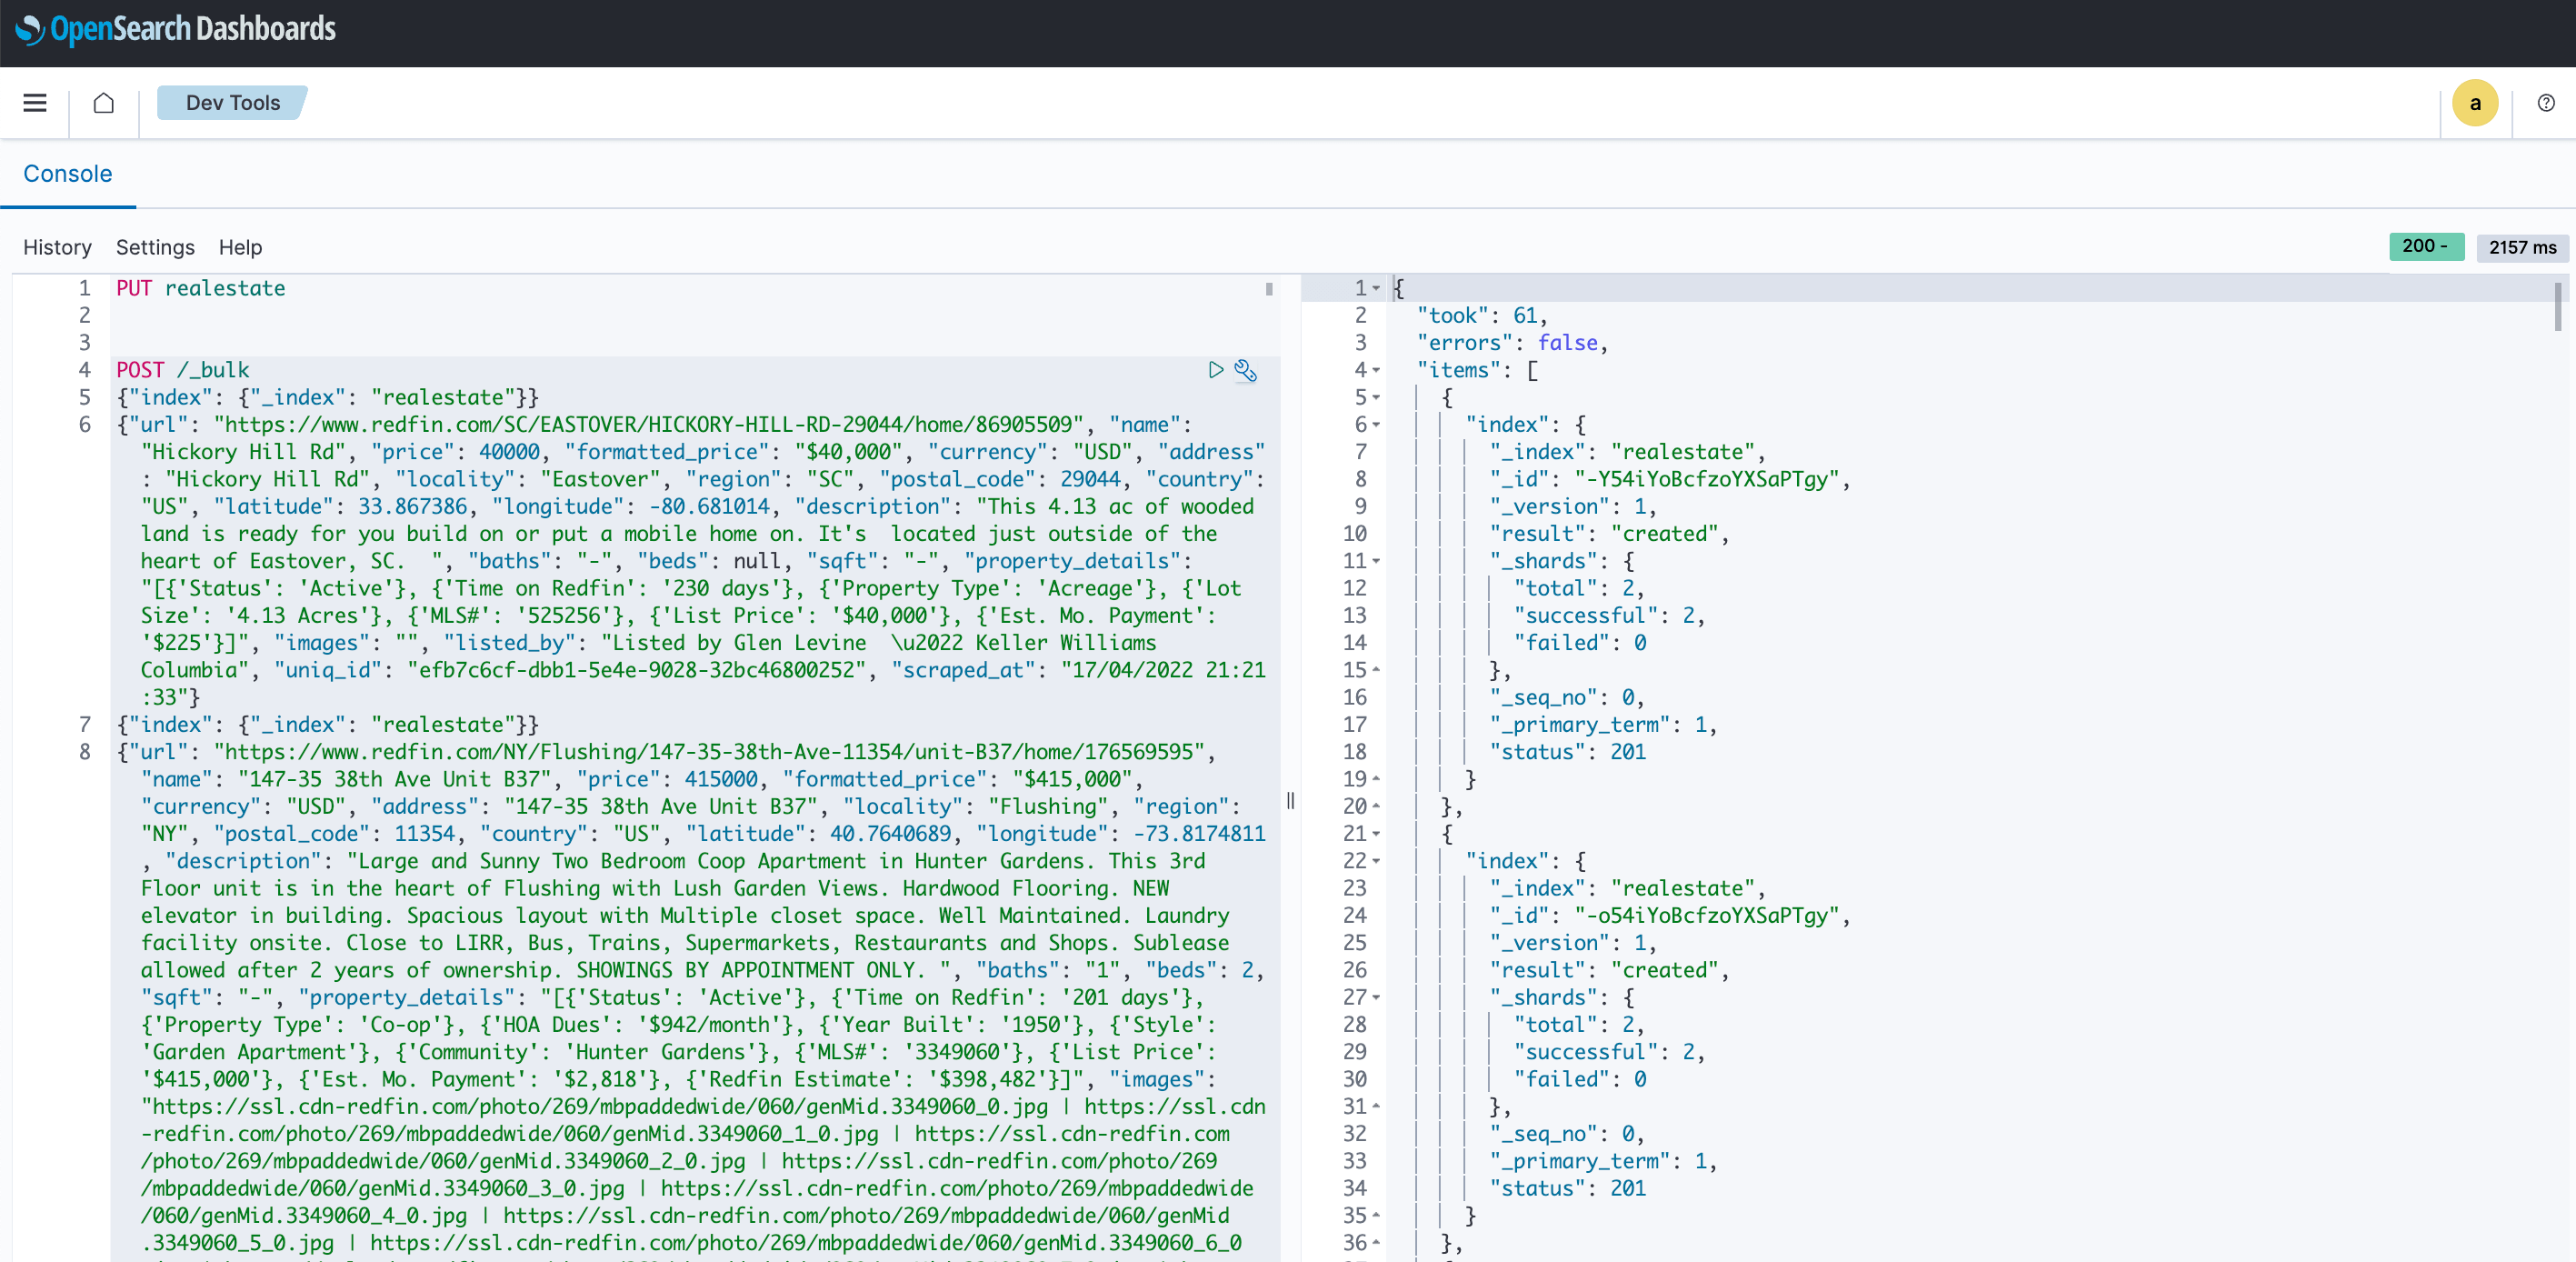
These commands create the realestate index and upload records into the catalog.
Now let’s visualize this data in a multi-layer map.
Add layers
To create your map and add layers, complete the following steps:
- On OpenSearch Dashboards, in the navigation pane, under OpenSearch plugins, choose Maps.
- Choose Create map.
You will see a default map (or basemap) loaded on the page with a Layers pane on the left. This serves as a canvas for the data. The OpenSearch basemap utilizes vector tiles, resulting in quicker loading speeds and seamless zooming compared to raster tile maps. It effectively accommodates zoom levels ranging from 0–22. 0 is the most zoomed out with the global view, and zoom level 22 is roughly a half-inch per pixel resolution. Any additional layers you add will appear in this pane.
- Choose Add layer.
- In the prompt, choose the option to add documents for the data layer.
- Under Documents, choose the index you created (
realestate) as the data source. - For the geospatial field, choose the field containing geopoints (such as
locationin this example). - Keep the remaining settings at their default values, then choose Update.
In the Layers pane, a newly generated layer named New Layer 2 will be visible. Additionally, you will observe the presence of all geopoints on the map (green dots in the following screenshot).
Update the layer name and enable tooltips
For an overview of the various configuration choices accessible for the layers, choose New Layer 2. This action opens another pane containing three tabs: Data, Style, and Settings. Let’s modify the layer’s name to something more relevant and enable tooltips. Complete the following steps:
- On the Settings tab, replace
New Layer 2withrealestate-datain the Name field. - On the Data tab, scroll down to Tool tips, and select Tool tips.
- Enter
regionas the tooltip. - Choose Update.
The altered name should now be visible in the left pane. The geopoints themselves don’t convey any information. However, with tooltips enabled, you can access comprehensive information depending on the fields selected. As you hover over the geopoints, you will observe the chosen tooltip information—in this instance, region CA.
Adjust zoom levels
The essence of this functionality lies in the ability to observe your data through distinct layers at varying zoom levels. To achieve this, generate a layer using the same process as before. The following example shows a new layer (locality) featuring tooltips displaying locality and postal code. You can also choose the color of your geographical points on the Style tab. On the Settings tab, you’ll encounter options for zoom levels, allowing you to input minimum and maximum values—like 4 and 6, for instance. Consequently, this indicates that the layer will be visible exclusively within this range of zoom levels.
In the Layers pane, you can observe three layers alongside the locality layer created in the previous step. A notification will indicate “Layer is hidden outside of zoom range 1-2.” This layer becomes visible as you zoom in.
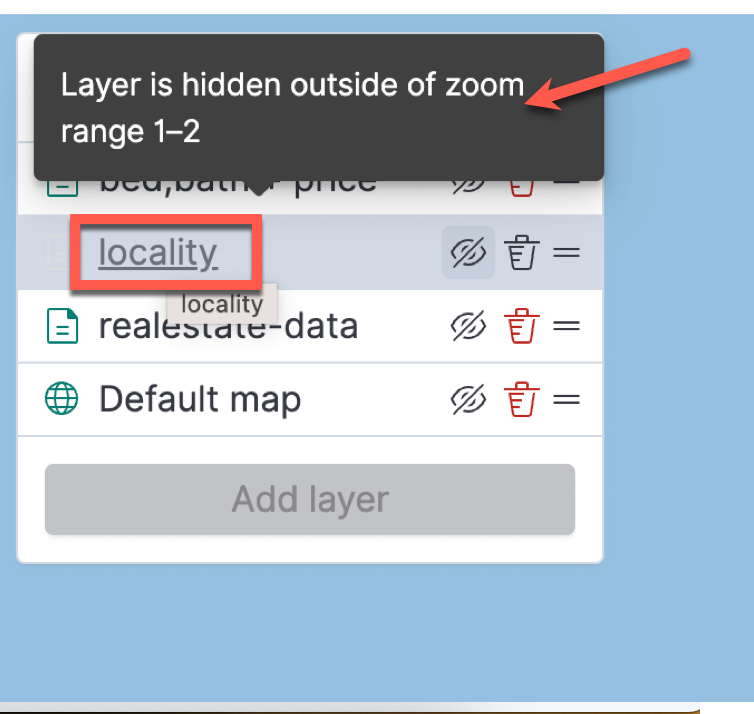
The realestate-data layer is set with a default zoom range of 0–22, ensuring visibility across all levels unless manually hidden. The locality layer is configured to be visible exclusively within the zoom range of 1–2.
As shown in the following screenshot, the tooltip for the realestate-data layer remains visible even after the fourth zoom level. To access the tooltip information for the locality layer, choose the eye icon next to realestate-data to manually conceal this layer. Once completed, hovering over the geopoints will reveal the tooltip details for locality (postal code and locality).
The following are some key points to consider:
- Each layer can be established with distinct colors for its geographical points. For instance, the
realestate-datalayer is depicted in green, while thelocalitylayer uses orange. - It’s possible to observe geopoints in a color that wasn’t directly chosen. In the following screenshot, brown is visible due to the overlapping of two layers at the same zoom level.
- You can observe the color shift to the layer’s designated color—orange—after
realestate-datais manually hidden, because there’s no longer an overlap between the layers.
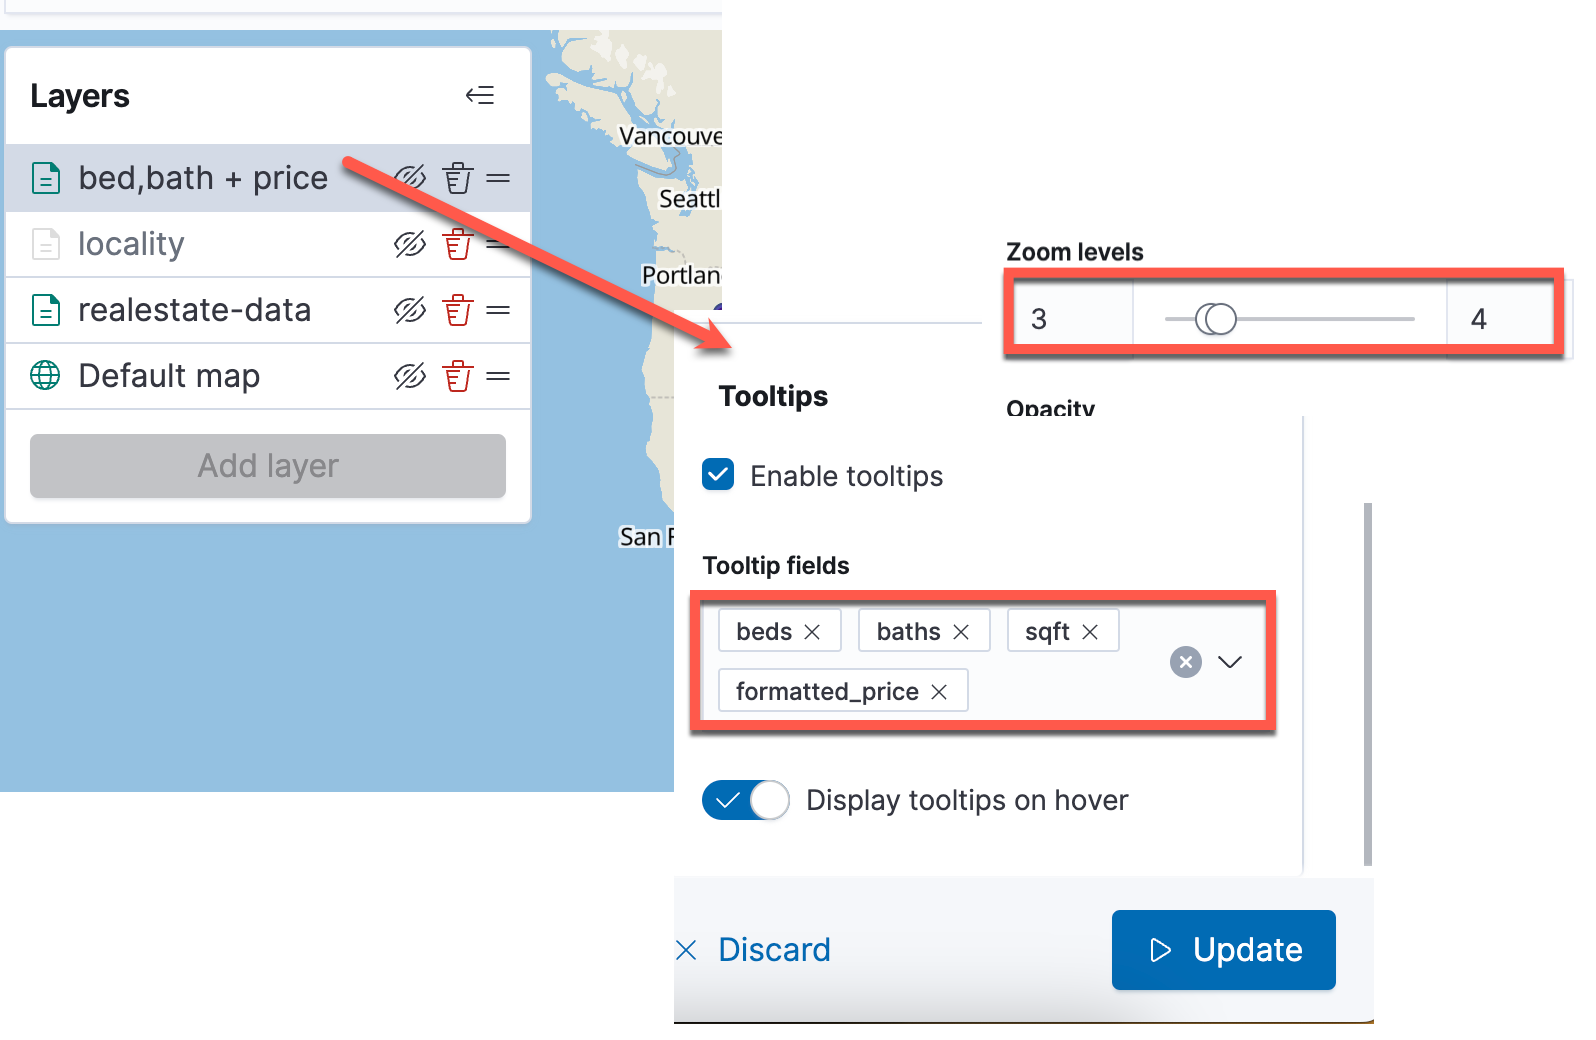
You can generate an additional layer designed to display tooltip data such as the count of beds, baths, price, and square footage. This layer will be active within the zoom range of 3–4.
To save your project, choose Save. Enter a title, such as realestate-multilayer-map, then choose Save again. Your multilayer map is now successfully saved!
Exploring the multi-level map
After you have established all the layers, take note of how the layers become visible or invisible at each zoom level. Observe the dynamic adjustments in tooltip information that correspond to these changes as you zoom.
Add a filter
After you have generated multiple layers and successfully visualized your geopoints, you might find that you are interested in specific properties, such as within a particular price range.
To add a filter at layer level, complete the following steps:
- In the right pane, on the Data tab, choose Filters.
- Input price as the filter criteria.
- Select is between as the operator.
- Enter 800000 for the start of the range and 1400000 for the end of the range.
- Choose Save to update the layer.
You’ll immediately observe the filter taking effect, resulting in the display of only the relevant data matching the filter.
An alternative method to establish a filter involves drawing shapes on the map, such as rectangles or polygons. In this instance, you’ll be utilizing the polygon option. (For API-based filtering, refer to APIs).
- Choose the polygon icon on the right side of the map.
- For Filter label, enter a name for the filter.
- Draw the shape over the map area that you want to select.
- For a polygon, select any starting point on the map (this point becomes a polygon vertex) and hover (do not drag) to each subsequent vertex and select that point.
- Make sure to select the starting point again to close the polygon, as shown in the following screenshot.
Add a map to a dashboard
You can add this map to an existing or a new dashboard. Complete the following steps:
- On OpenSearch Dashboards, choose Create and choose Dashboard.
- Select Add an existing dashboard.
- Choose
realestate-multilayerfrom the list.
You can see the new visualization on your dashboard.
- Choose Save and enter a title for the dashboard.
Conclusion
In this post, you effectively established multi-layer maps for data visualization, analyzed geographic data, observed various data at varying zoom levels, added tooltips for supplementary data visualization, and added multi-layer maps to dashboard panes within OpenSearch Dashboards to easily analyze your geospatial data. Refer to Using maps for an alternative use case and detailed information about map features.
About the authors
 Aish Gunasekar is a Specialist Solutions Architect with a focus on Amazon OpenSearch Service. Her passion at AWS is to help customers design highly scalable architectures and help them in their cloud adoption journey. Outside of work, she enjoys hiking and baking.
 Satish Nandi is a Senior Technical Product Manager for Amazon OpenSearch Service.
 Jon Handler is a Senior Principal Solutions Architect at Amazon Web Services based in Palo Alto, CA. Jon works closely with OpenSearch and Amazon OpenSearch Service, providing help and guidance to a broad range of customers who have search and log analytics workloads that they want to move to the AWS Cloud. Prior to joining AWS, Jon’s career as a software developer included 4 years of coding a large-scale, ecommerce search engine. Jon holds a Bachelor of the Arts from the University of Pennsylvania, and a Master of Science and a PhD in Computer Science and Artificial Intelligence from Northwestern University.
Source: https://aws.amazon.com/blogs/big-data/build-multi-layer-maps-in-amazon-opensearch-service/