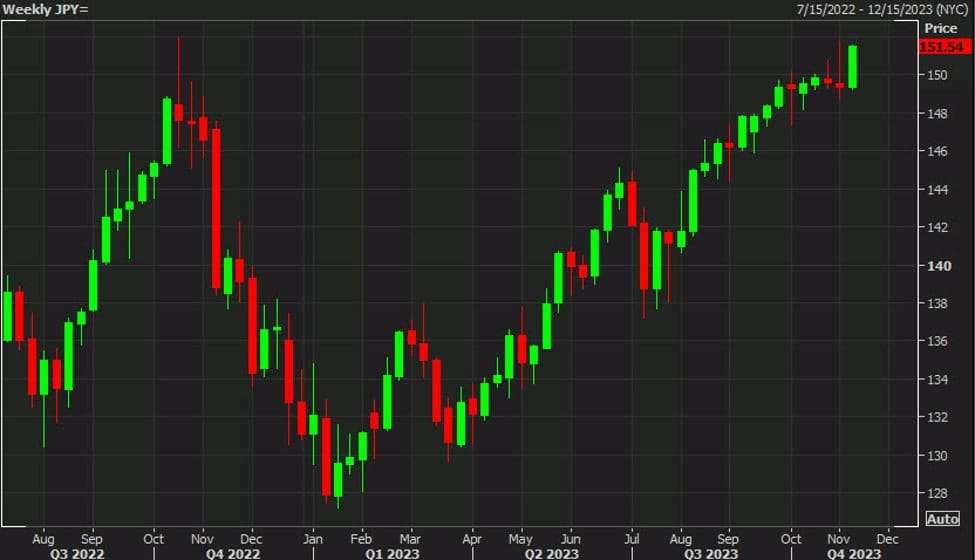
USDJPY weekly chart
USD/JPY has risen every day this week and is now within striking distance of some major levels.
The 32-year high in this pair came in October of last year at 151.94 and was followed by intervention from the Japanese Ministry of Finance and a fall all the way to 128.00 within three months. Since then it’s marched back higher and rose to 151.74 last week before backing off briefly.
Now as the week winds down we are within striking distance of both those levels, which will be key ones to watch next week.
What’s ominous is that the rally has come even with yields falling. US 10-year yields are at 4.62% from a high of 5.04% three weeks ago. US 2-year yields are also down 20 basis points from the cycle high.
I have a hard time envisioning any scenario that doesn’t involve the MoF being tested once again. They may need ot let the 152.00 level go but right here the risk-reward is tough because they could intervene at any time. I think we ultimately get to 155.00 but the trade is to buy a dip not chase a break because even if the top goes, buyers will tread carefully.
Source: https://www.forexlive.com/news/usdjpy-touches-15160-as-it-eyes-the-32-year-high-20231110/