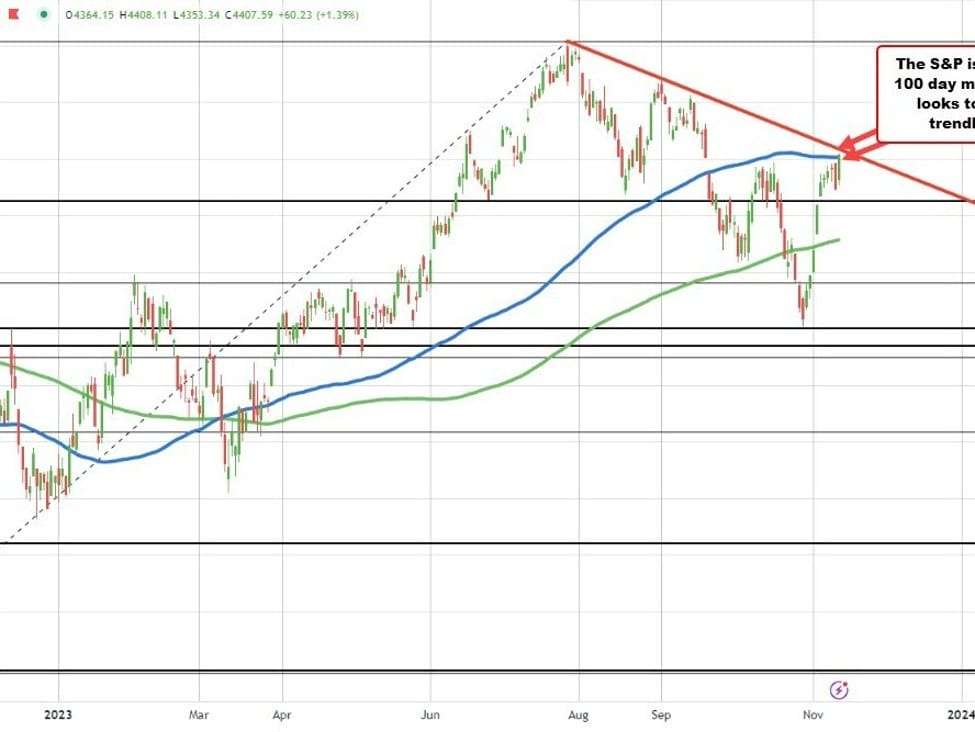
S&P indexes moving above its 100 day moving average
The S&P index is currently trading near session highs, up 60.44 points or 1.39% at 4407.92, and in the process has broken above its 100-day moving average of 4402.47 (see the blue line in the chart above).
The last time it traded above this moving average was on September 20, after which it gapped below it the following day, remaining below it until now. During this period, the index reached its low on October 27 at 4100.51. From that low to today’s high, the index has risen by 7.4% over 10 days of trading.
Similarly, the NASDAQ index has also climbed back above its 100-day moving average (blue line in the chart below), currently at 13617.84. Although it briefly closed above this level on Tuesday and Wednesday, it couldn’t surpass the high price from October 12 at 13714.14. Yesterday, a sell-off driven by Chair Powell’s comments and a challenging 30-year auction pushed the price below the moving average. However, today’s strong rally, with the index up 253 points or 1.87%, has not only taken it above the 100-day moving average but also above the high price from October. Bullish.
NASDAQ is back above its 100 day moving average