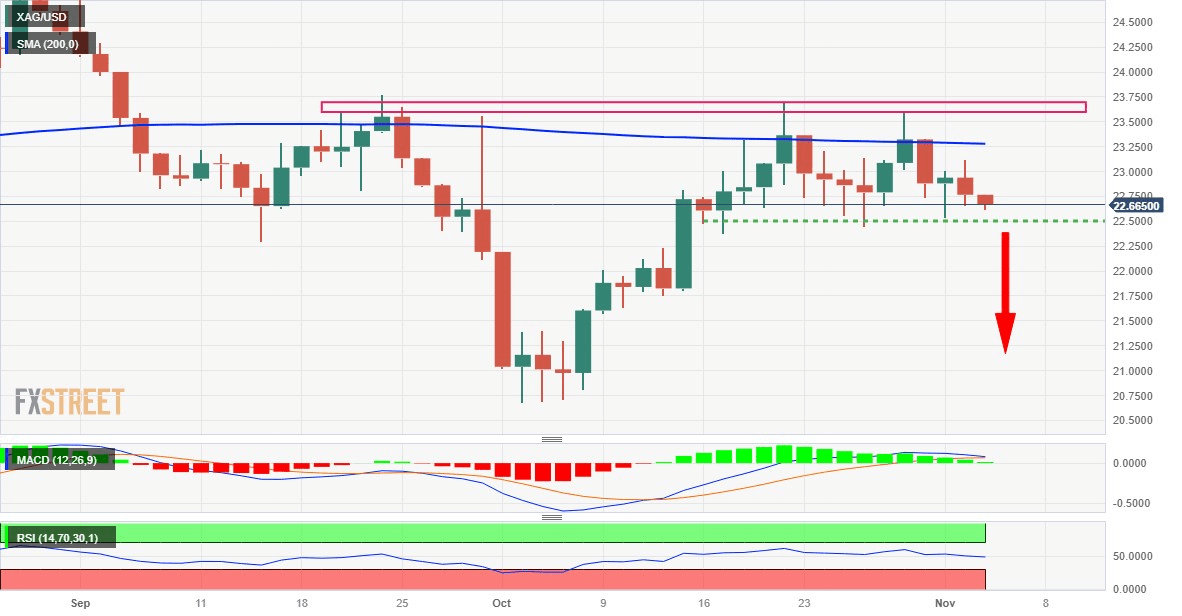
- Silver remains under some selling for the second straight day and drops closer to the weekly trough.
- The technical setup favours bearish traders and supports prospects for additional near-term losses.
- A sustained strength beyond the $23.60-$23.70 supply zone is needed to negate the negative bias.
Silver (XAG/USD) drifts lower for the second successive day on Friday – also marking the third day of a negative move in the previous four – and drops to the lower end of its weekly range during the early part of the European session. The white metal currently trades around the $22.65-$22.60 region, down over 0.50% for the day, and seems vulnerable to weaken further.
The recent repeated failures to find acceptance above the 200-day Simple Moving Average (SMA) and rejections near the $23.60-$23.70 supply zone constitute the formation of a multiple tops pattern. Furthermore, technical indicators on the daily chart have again started gaining negative traction and validate the near-term bearish outlook for the XAG/USD. That said, it will still be prudent to wait for some follow-through selling below the $22.50 support zone before positioning for further losses.
The XAG/USD might then accelerate the fall to the $22.00 mark before dropping to the $21.70 horizontal support zone en route to the $21.35-$21.30 region. The downward trajectory could get extended further and drag the white metal below the $21.00 mark, towards the $20.70-$20.65 area, or a seven-month low touched in October.
On the flip side, the $23.00 round figure now seems to cap the immediate upside ahead of the $23.10-$23.15 horizontal barrier. This is closely followed by the 200-day SMA, currently around the $23.25 region, above which the XAG/USD could challenge the $23.60-$23.70 supply zone. The latter should act as a key pivotal point, which if cleared decisively will negate the negative outlook and shift the near-term bias in favour of bullish traders, paving the way for a move towards the $24.00 mark.
Some follow-through buying has the potential to lift the XAG/USD beyond the $24.20-$24.25 intermediate resistance and allow bulls to make a fresh attempt to conquer the $25.00 psychological mark.


