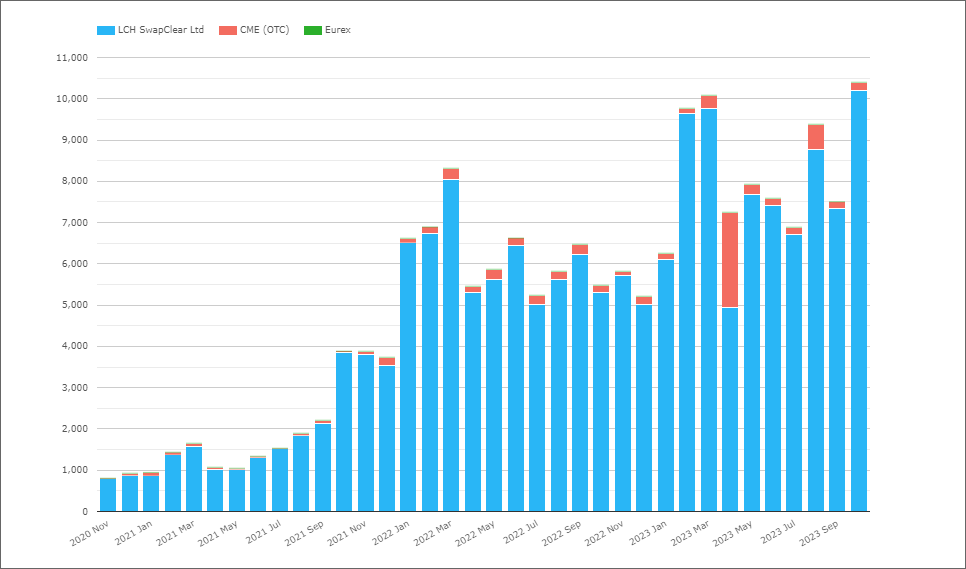
This week I will start with a chart – the DV01 traded in USD OIS per month over the past three years:
Showing;
- October 2023 saw a record amount of risk traded as a USD OIS.
- It was only the second time in history that more than $10bn of DV01 has traded in a single month.
- Clearly the chart would look different if we also included Interest Rate Swaps – the chart effectively excludes all LIBOR trading.
- But still a pretty good indication of the health of the markets – volumes hitting all time records tends to always be good news!
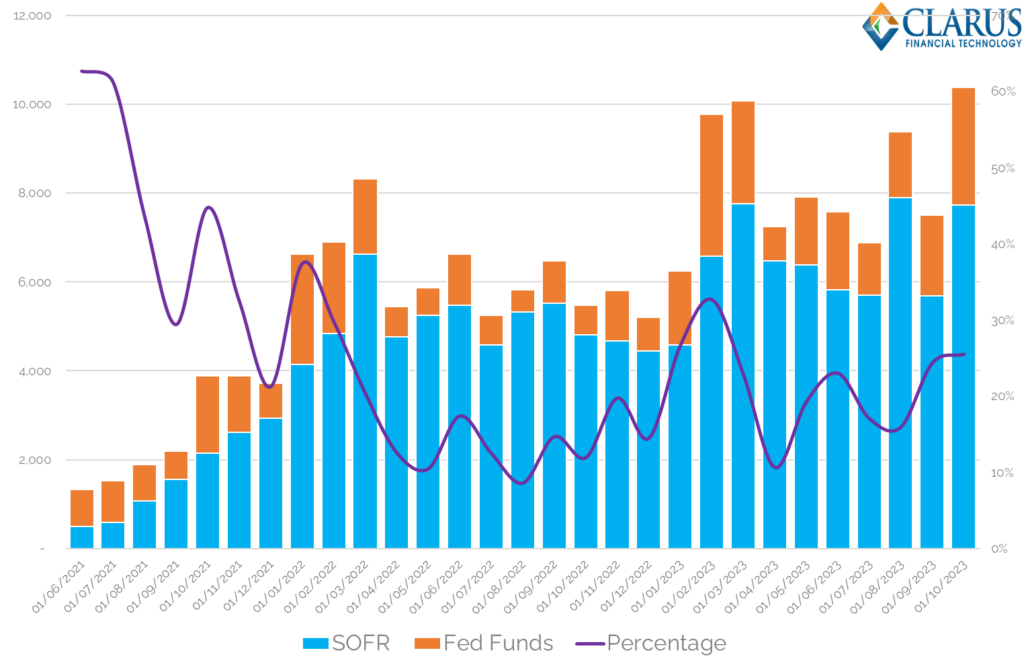
For the second chart today, consider the same data, but split by OIS Index – SOFR or Fed Funds:
Showing;
- SOFR risk in blue bars, Fed Funds in orange.
- October 2023 was one of the top 3 months ever for the amount of SOFR DV01 traded – it looks to have been beaten by only March and August this year, but not by much.
- The amount of Fed Funds risk traded in October 2023 was the second highest in the time series – beaten only by February of this year.
Overall, 26% of OTC OIS risk was traded versus Fed Funds – the highest since USD LIBOR cessation, but lower than the February high. The relative proportion of risk traded as Fed Funds is volatile – ranging from 11% to 33% in 2023 alone. There doesn’t seem to be a pattern emerging.
It is tempting to say that SOFR risk represents “real” trading whilst Fed Funds is more likely speculative trading, but that seems way too simple/banal/flippant to be true.
For readers of this blog, it is undoubtedly interesting data. It makes the relative “health” of the market more difficult to ascertain – and raises a question over whether we should even care which indices are trading? Did we care whether LIBOR saw a change in the proportion of 1 month, 3 month and 6 month indices trading? Did we even have the data (no!).
Futures
We cannot say from the OTC data that the proportion of risk traded versus Fed Funds has anything to do with the market appetite to trade RFRs. The gut feeling is that Fed Funds activity has more to do with short-dated repositioning around expected Fed activity – but there is nothing in the data to back that up.
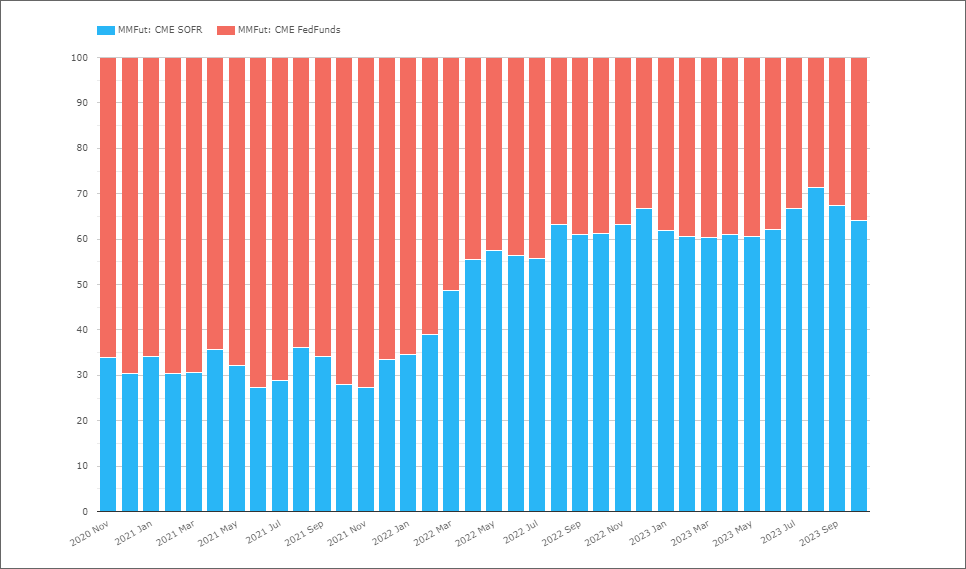
Cross checking this OTC data, I have the futures analysis below. This shows an even higher proportion of risk – 36% – traded versus Fed Funds futures. However, 36% is not that unusual in futures markets:
Adoption
What the data does show is that a record amount of OIS risk traded last month. That did not result in a record for the RFR Adoption Index though, because over a quarter of that risk was versus a non-RFR (Fed Funds!).
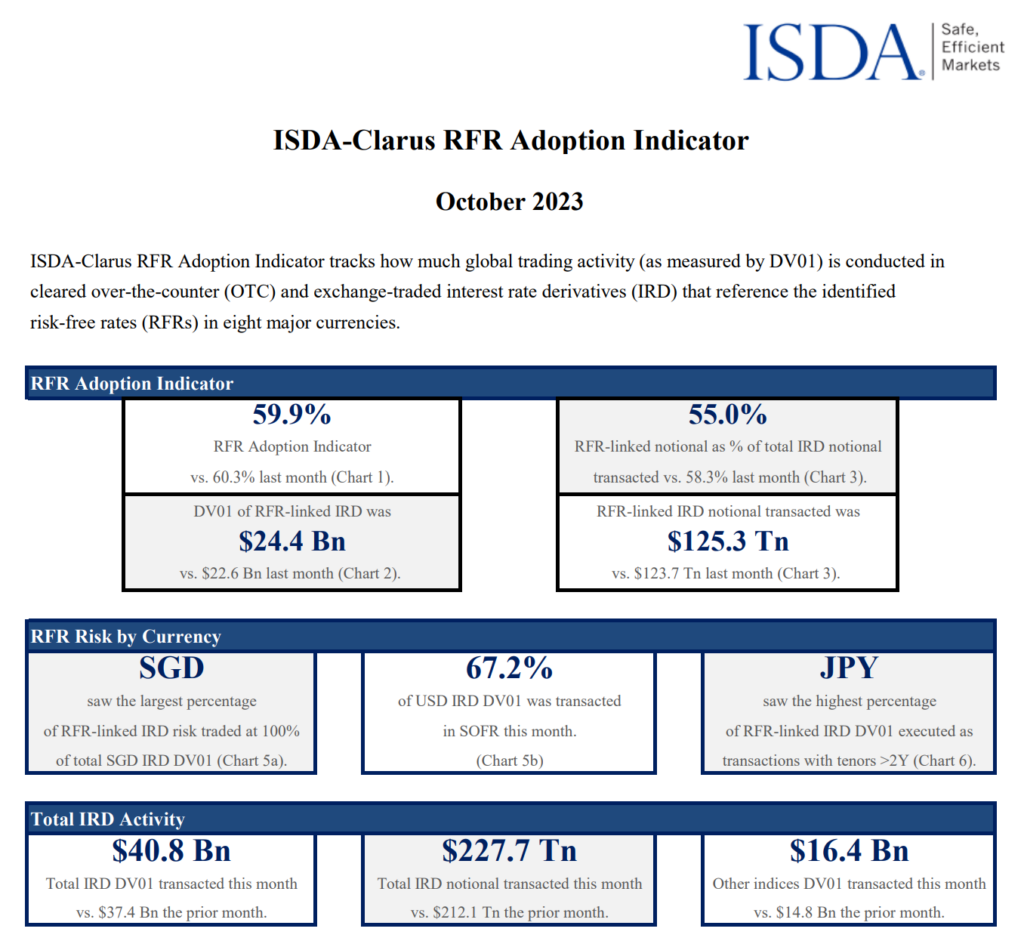
From ISDA:
Showing;
- The index decreased again to 59.9%, 0.4% lower than last month.
- SOFR trading was 67.2% of the overall USD market – the rest was versus Fed Funds.
- €STR adoption dropped slightly to 34.1%.
- In USD markets, 26% of USD OIS risk in OTC markets was traded vs Fed Funds – 2% higher than last month. 36% of USD Futures risk was traded versus Fed Funds, 3.3% higher than last month.
- CAD recorded a new all time high for CORRA adoption at 81.8%, another healthy increase well in advance of CDOR cessation in the middle of next year.
In Summary
The data around RFR Adoption continues to be more volatile post-cessation than we expected. It does not necessarily mean that there is anything concerning here, it just takes a bit of brain power to decipher the underlying data. If anything, it highlights how interesting market structure continues to be.