The start of 2023 has been explosive for the digital assets landscape, with Bitcoin recording a 41% move upwards YTD, as well as significant regulatory challenges developing in the USA. We have also seen the unexpected phenomena of Ordinals and Inscriptions arise on the Bitcoin blockchain, sparking healthy debates regarding the usage of protocol blockspace.
January and February have also been busy for the Glassnode team, constructing 47x new metrics and 30x new workbench charts, as well as releasing a variety of research articles to help our readers keep a pulse on the market. A summary of the metrics, content, and product releases for these months are as follows:
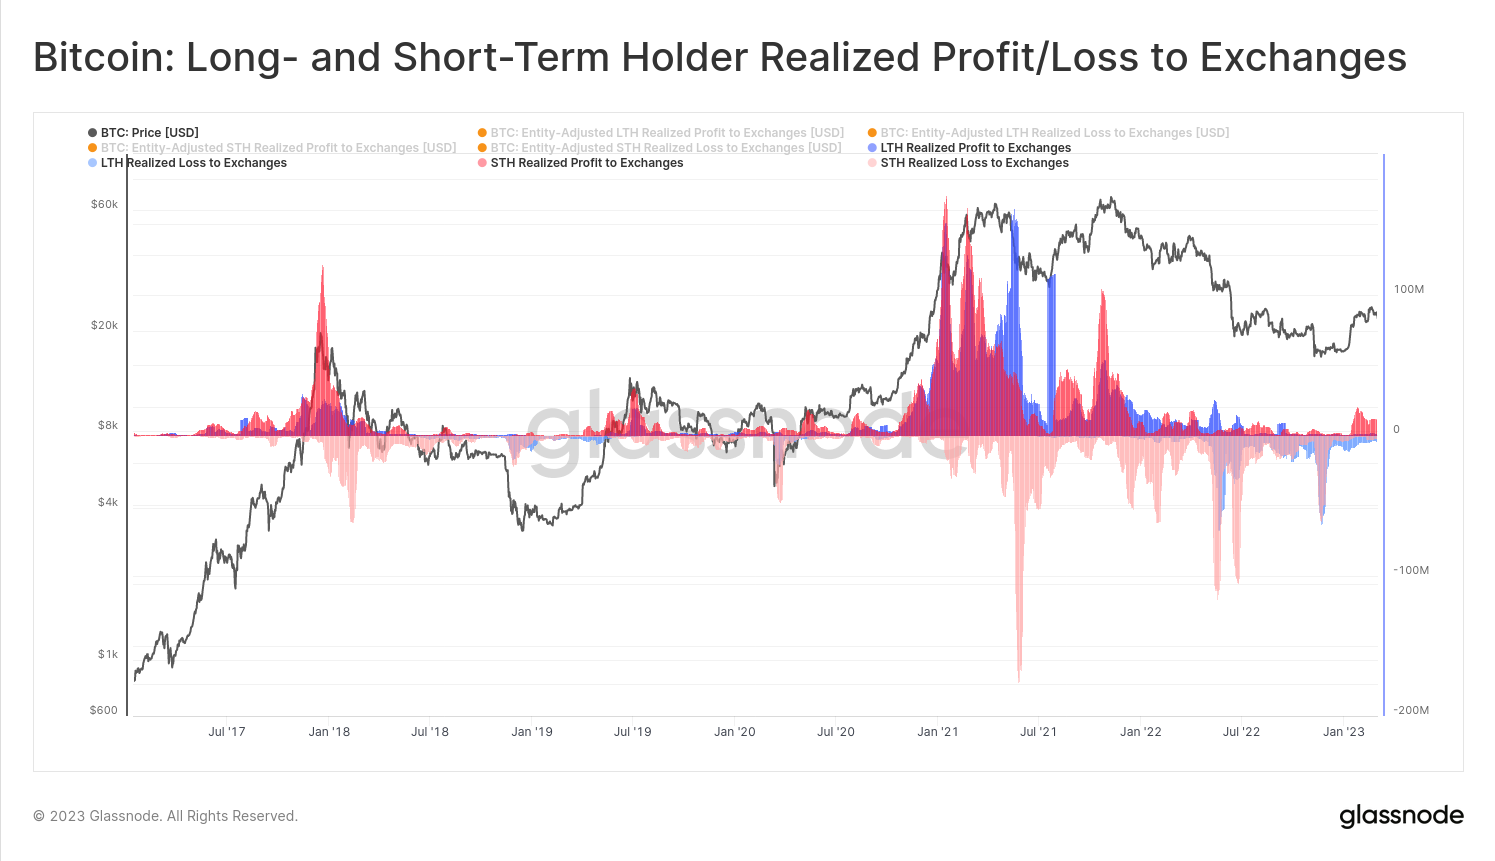
- New Professional Suite of Metrics (47x) combining some of the most powerful on-chain techniques: Cohorts (Long/Short-Term), Realized Profit/Loss, Lifespan, and Volume sent to Exchanges.
- On-chain Signals Released (1x) for tracking confluence and indicators for identifying a potential Recovery from a Bitcoin Bear.
- Week-on-Chain Newsletters (8x) covering the extensive capital reset amongst market participants, and documenting the years strong performance so far.
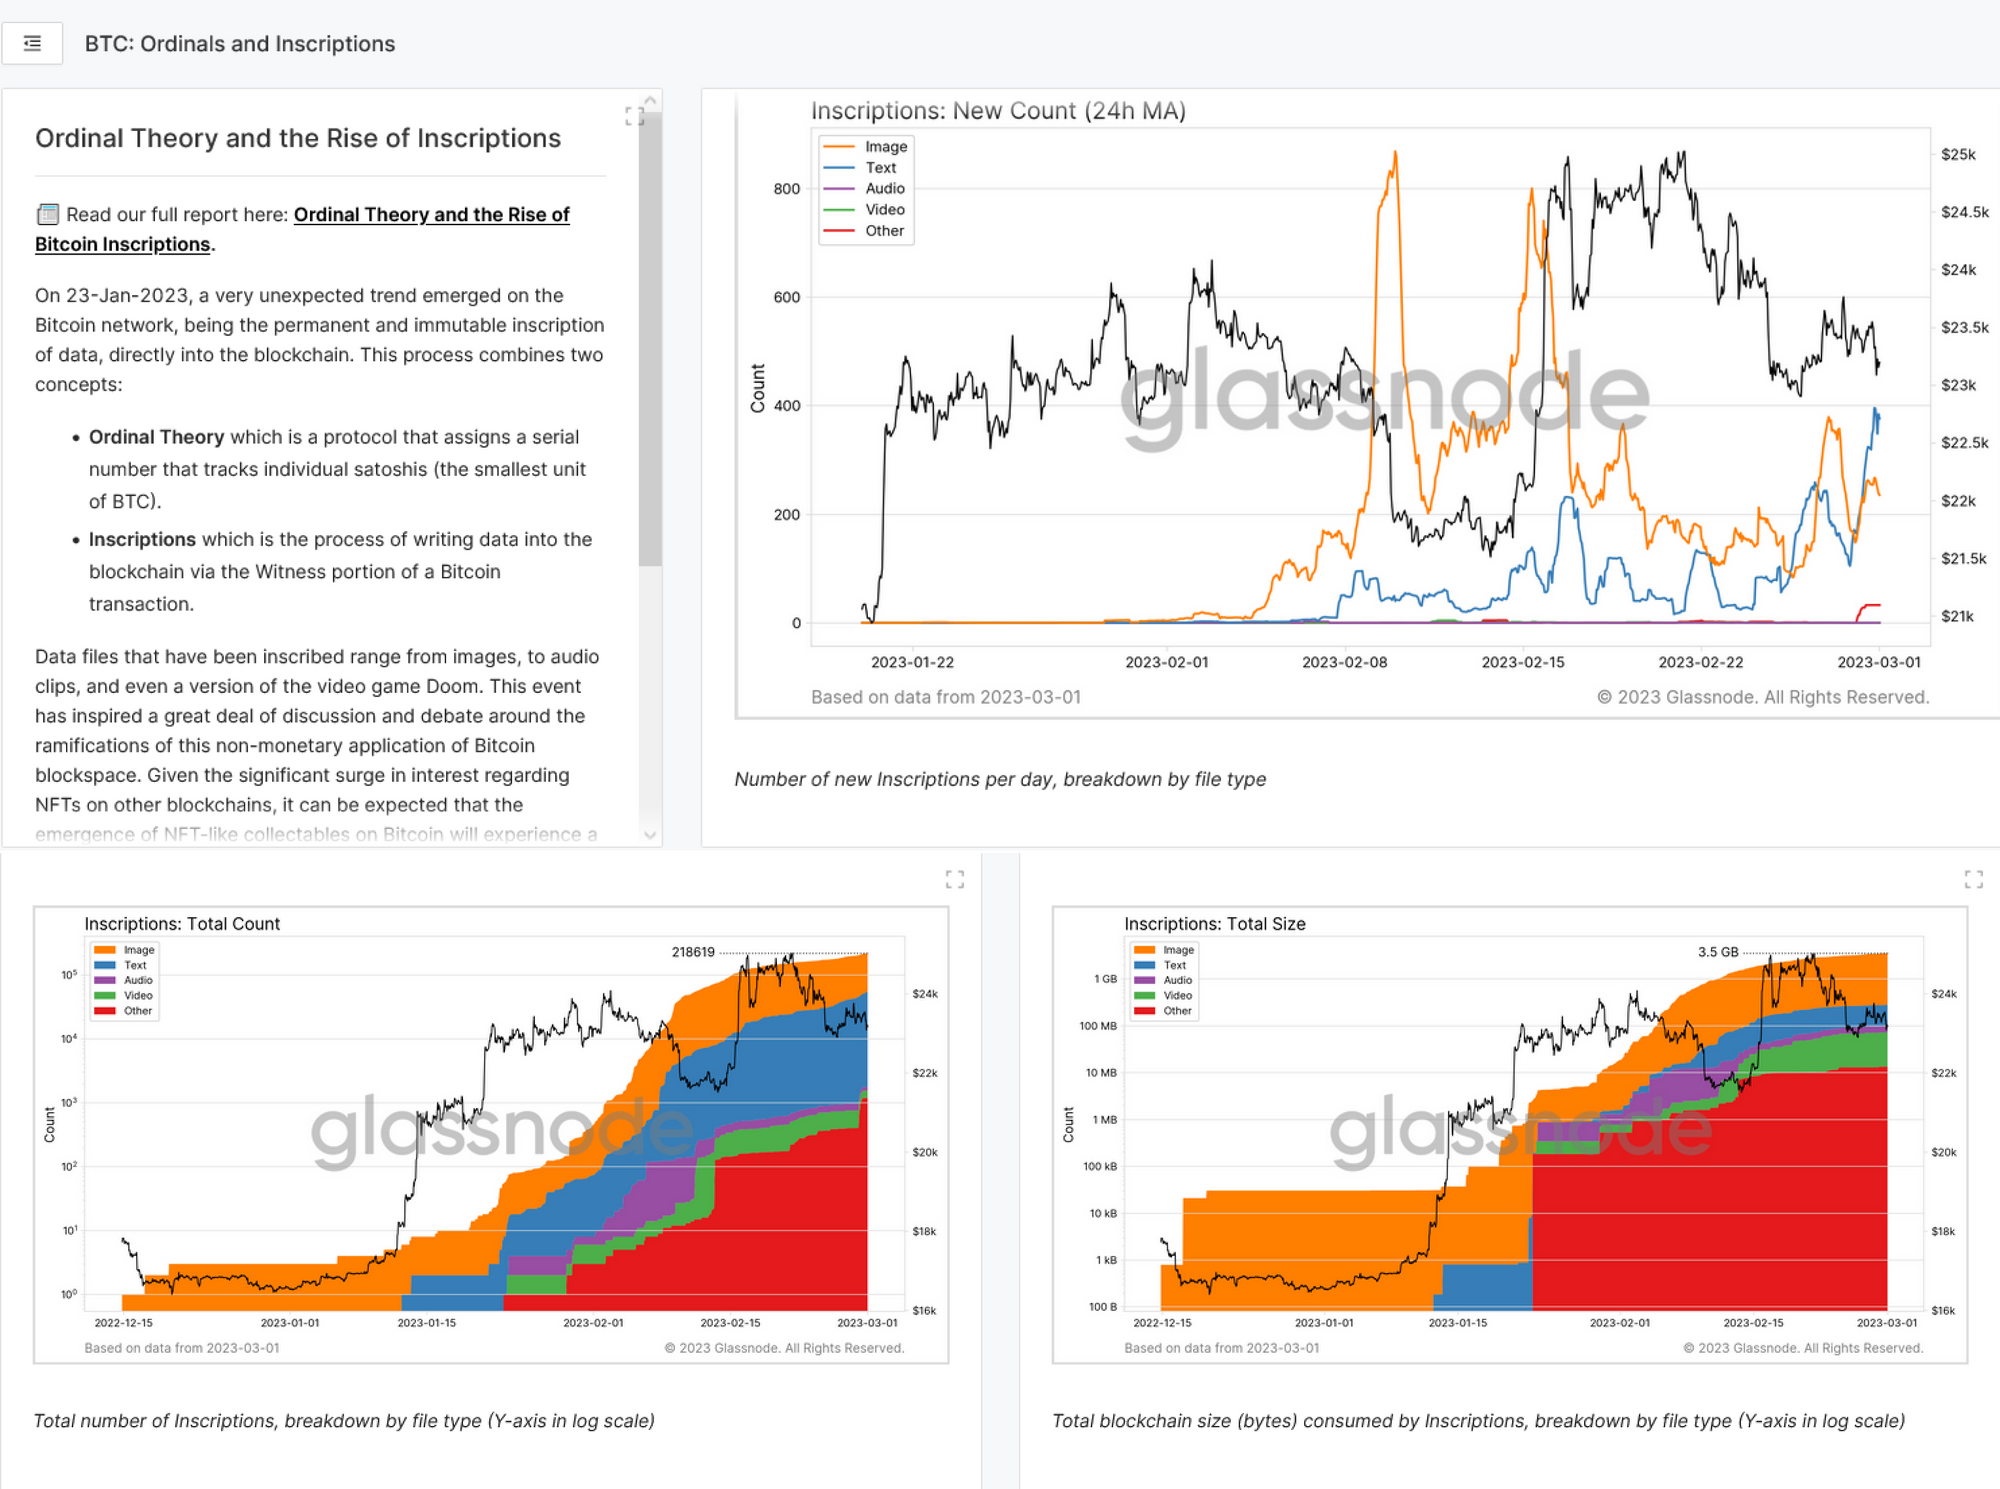
- Research Papers (3x) covering the emergence of Ordinals and Inscriptions, a masterclass on the MVRV, and new tools to spot signs of recovery out of bear markets.
- New Dashboards (9x) ranging from pricing models, Realized Profit/Loss, and mastering the MVRV Ratio for BTC and ETH.
- New Workbench Constructions (30x) such as pricing models derived from statistical deviations, Old and Young coin supply heuristics, and many more.
We are extremely proud to announce the release of our new Professional Metric Suite expanding the current Professional set by an additional 47x metrics. This suite combines three exceptionally powerful on-chain concepts:
- Cohort Analysis: breaking down coin flows into Long and Short-Term Holders.
- Realized Profit/Loss: Capturing investor sentiment, and capital flows into the asset.
- Volumes to Exchanges: Leveraging our best-in-class clustering and labelling to identify transfer volumes most likely to affect near-term market action.
These topic areas are where our team continues to find powerful and unique insight, as well as accurate readings on Bitcoin market sentiment and capital flows. These tools are then supercharged by leveraging our advanced wallet labelling systems and entity-adjustment, isolating flows specifically related to exchanges.
As an example, the metric below presents Realized Profit and Loss, locked in by Long and Short-Term Holders, considering only coins sent to Exchanges. We hope you are as excited as we are to dig into this suite, and take Bitcoin on-chain analysis to new heights.
You will find the full 47x long metric suite in our changelog.
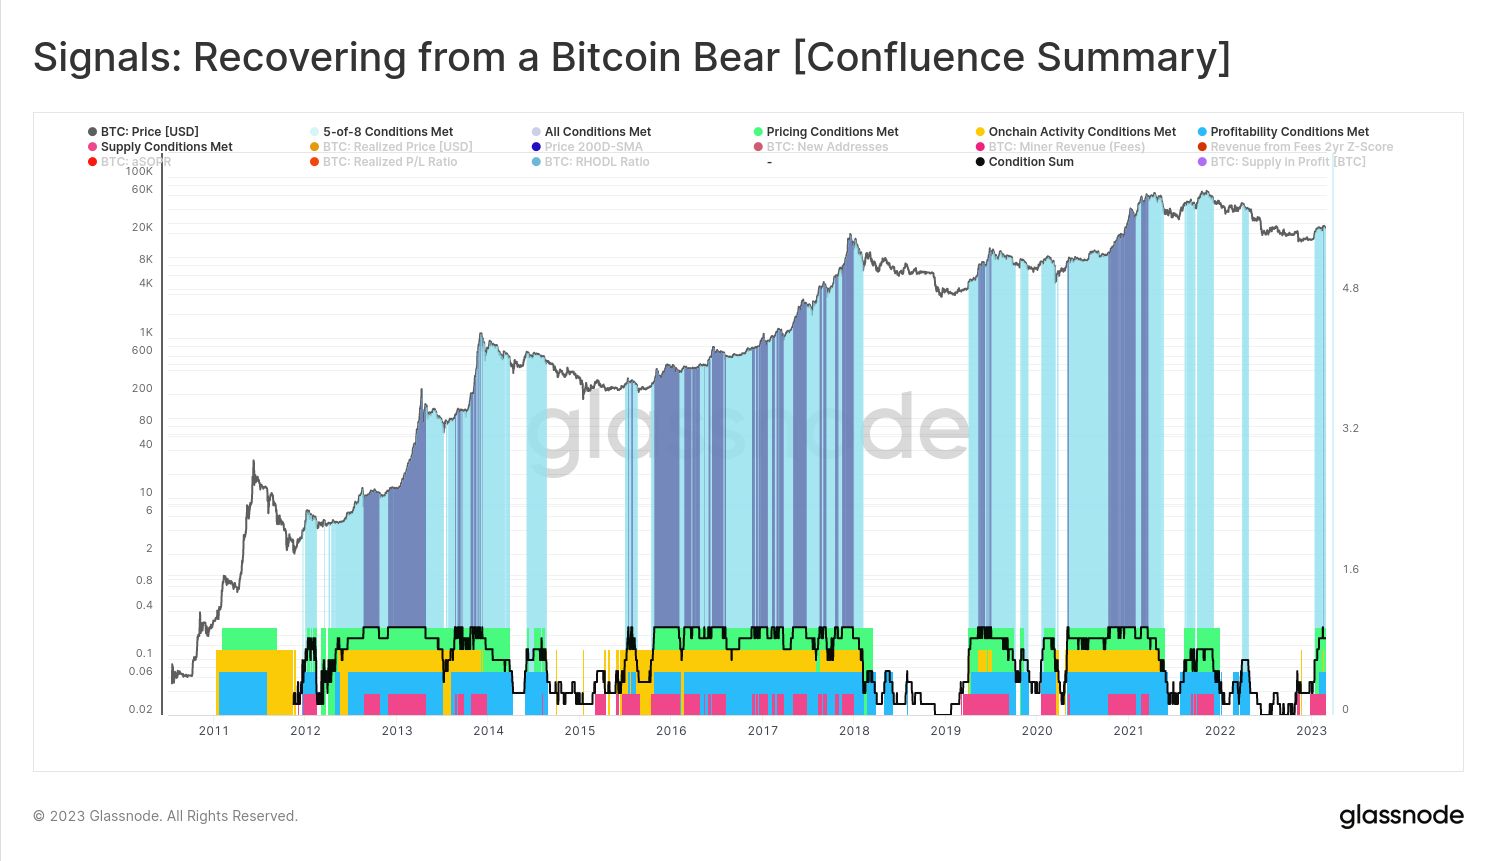
On-chain analysis can be a nuanced topic, especially for assessing the market across several areas, and looking for confluence. To aide in this journey, we are pleased to release our first On-chain Signals dashboard, which seeks confluence for when the Bitcoin market is recovering from a protracted bear market.
This tool combines insights and key thresholds across four on-chain concepts:
- 🟢 Spot Prices trading above key Pricing Models (both technical and on-chain)
- 🟡 Increasing momentum in network utilization (higher on-chain activity, increased network congestion, more fee revenue)
- 🔵 Market Profitability Returning (indicating seller exhaustion, profits are being taken and market is absorbing sell-side)
- 🔴 Balance of USD Wealth is in favor of longer-term HODLers (indicating that a high conviction holders are the dominant owners of the coin supply)
Visit our On-chain Signals dashboard: Recovering from a Bitcoin Bear
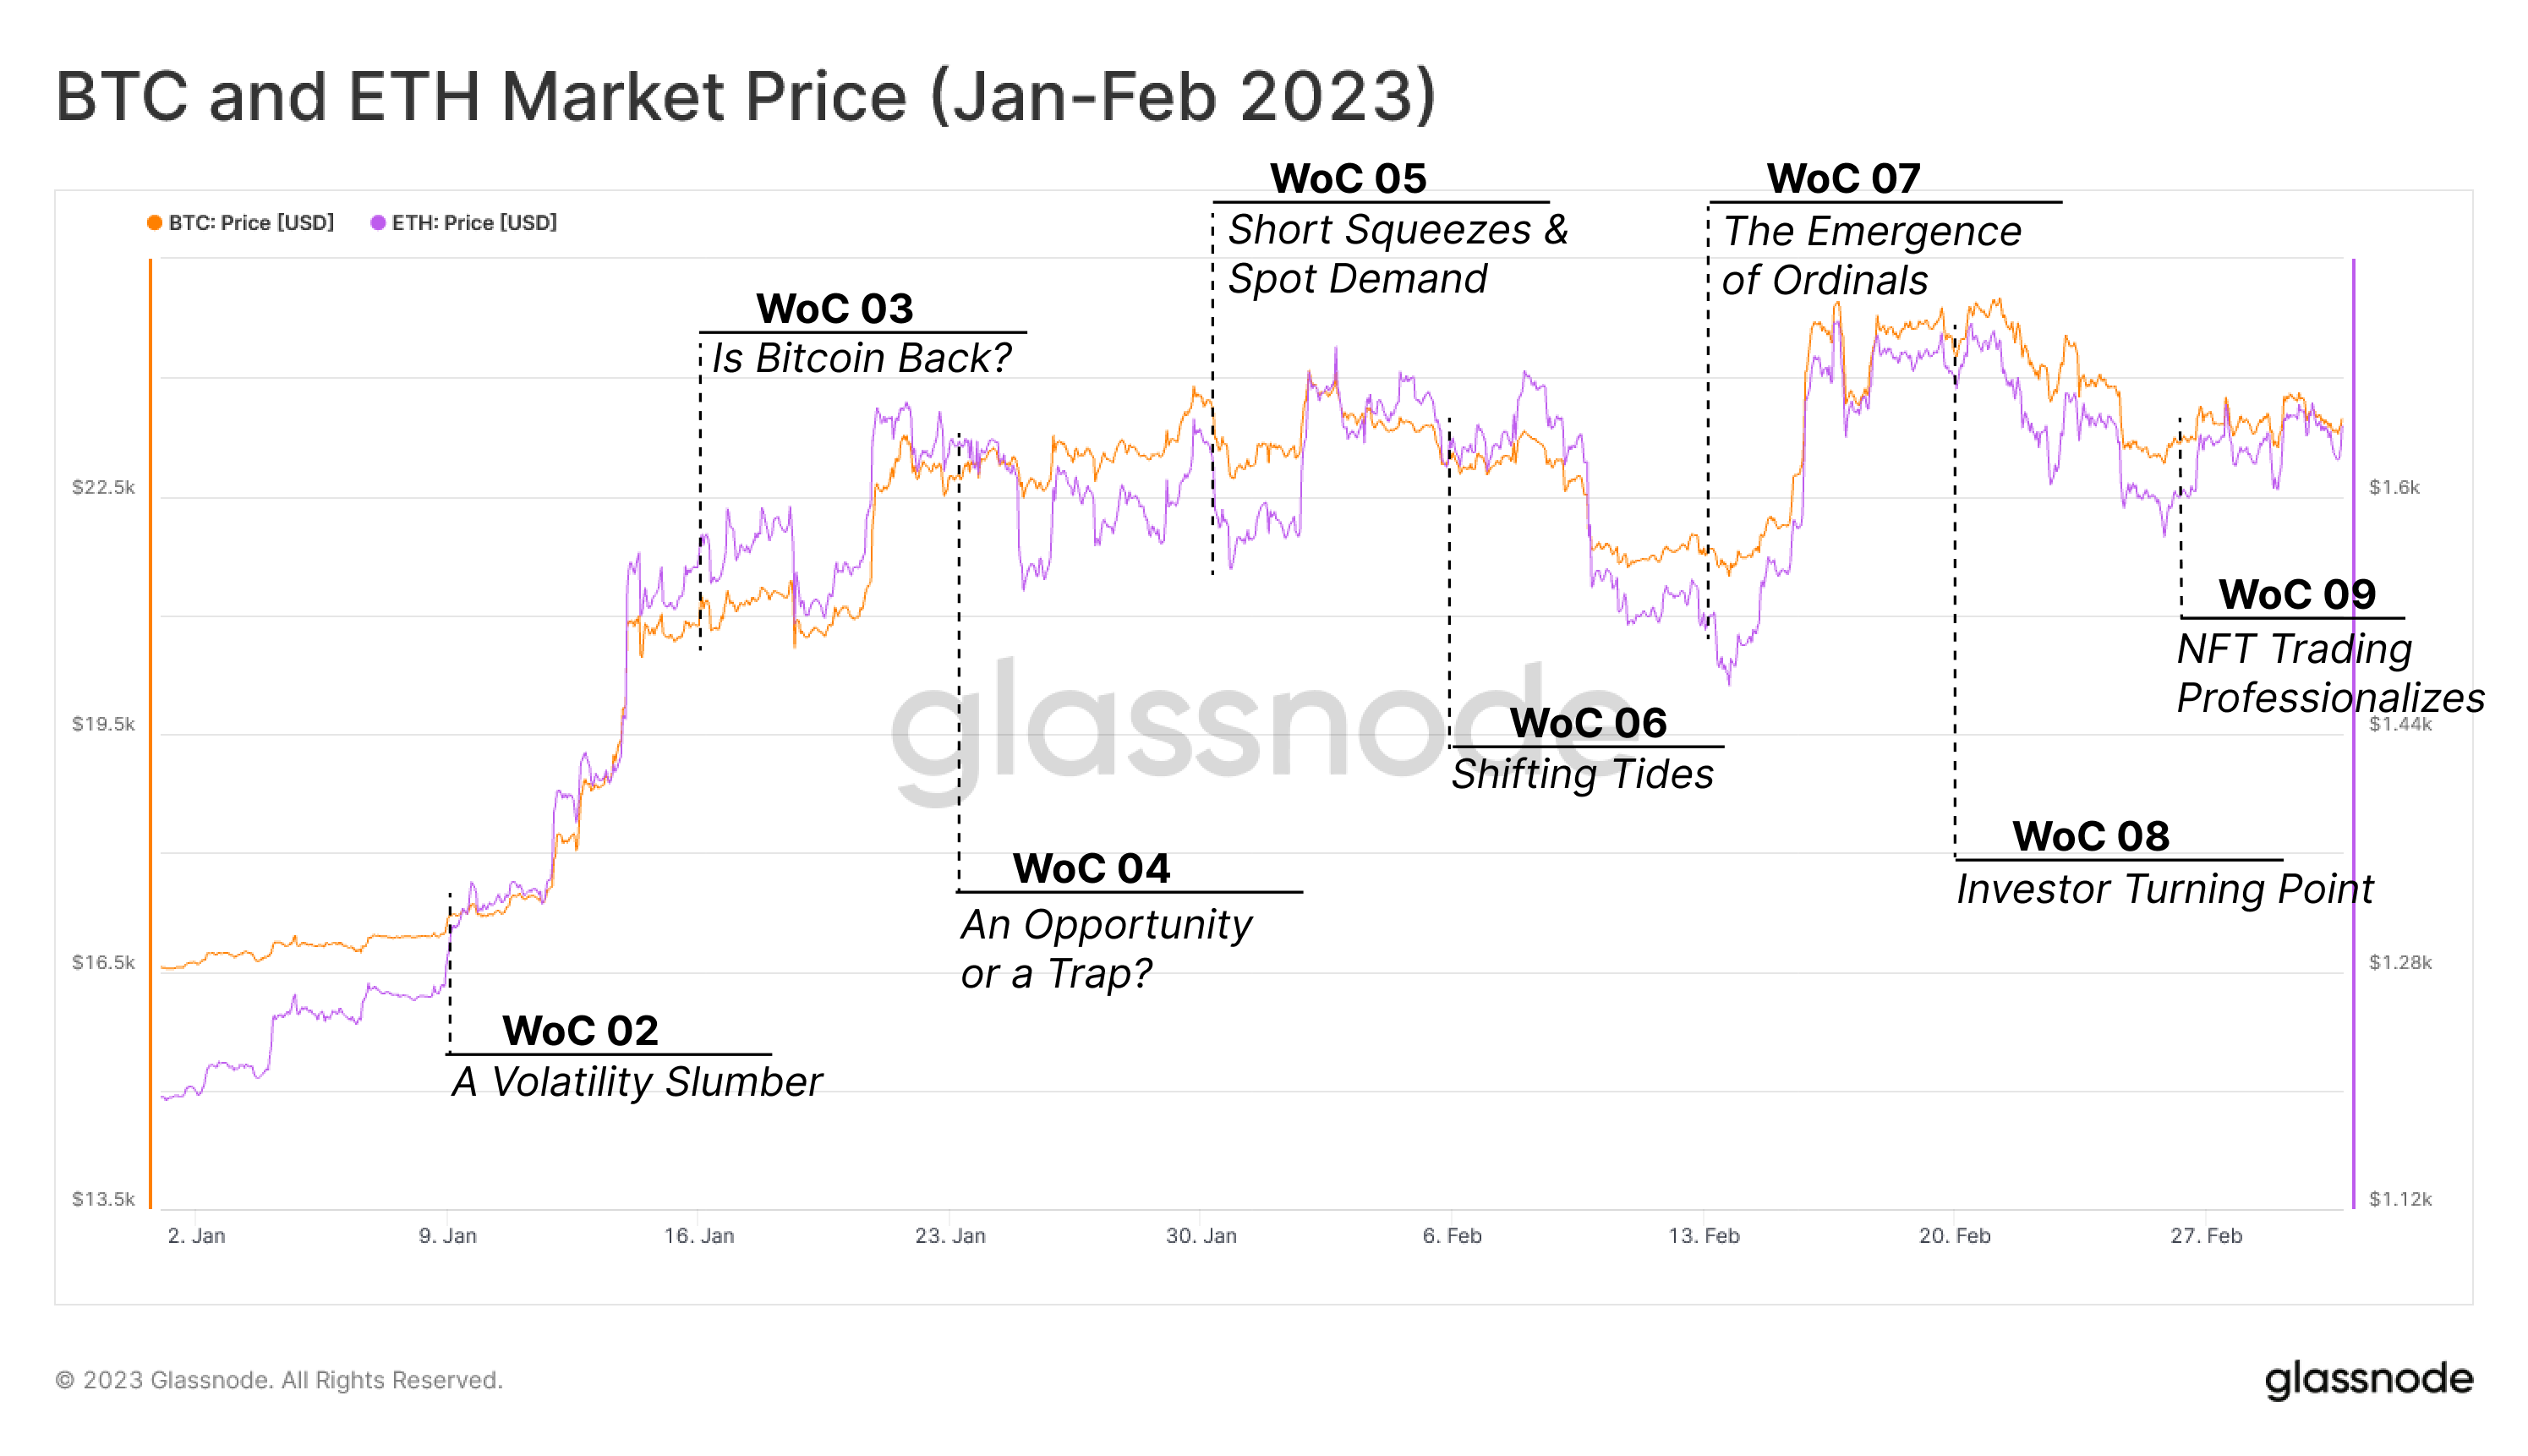
The opening months of the new year quickly moved from historically quiet (WoC 2), to exceptionally exciting, as Bitcoin experienced a 40%+ move upwards YTD (WoC 3). Price broke above and has been consolidating above the on-chain cost-basis of several cohorts (WoC 4). This process squeezed a large volume of short traders from their positions (WoC 5), and puts the average Bitcoin holder into a regime of unrealized profit. As such, a potential turning point of the macro market tides may well be underway (WoC 6).
However, news of heavy US regulatory moves (WoC 8), and SEC crackdowns (WoC 7) have become a feature of the year to date, despite the market largely shrugging it off. We have also seen the unexpected emergence of Ordinals and Inscriptions on Bitcoin has also forged a new, and unforeseen demand for blockspace (new Professional Dashboard), and Ethereum has seen a sharp resurgence in the popularity of NFTs.
The NFT market is currently experiencing great competition, with new marketplace Blur taking market share from leader OpenSea, driven by a strategy focused on traders and liquidity (WoC 9).
The Week On-chain Newsletters Released
- WoC #2: A Volatility Slumber (Report)
- WoC #3: Is Bitcoin Back? (Report)
- WoC #4: An Opportunity. or a Trap? (Report)
- WoC #5: Short Squeezes and Spot Demand (Report)
- WoC #6: Shifting Tides (Report)
- WoC #7: The Emergence of Ordinals (Report)
- WoC #8: Investor Turning Point (Report)
- WoC #9: NFT Trading Professionalizes (Report)
Alongside our flagship Week-On-Chain newsletters, the Glassnode Analyst team was busy at work preparing new bespoke research reports. These range from a comprehensive guide on spotting key inflection points for navigating through the transition from Bear to Bull, to an in-depth report on the rise of Ordinals and their realized and future implications for the fee market and chain size, and finally an educational piece on understanding one of On-Chain analytics greatest tools in the arsenal, the MVRV Ratio.
Research Papers Released

At Glassnode, we believe data driven insights answer many of our biggest questions in digital asset markets. Thus, we have released and released a suite of 8x Dashboards which help contextualize, and answer core questions.
Bitcoin
Ethereum
Workbench Tutorials
Workbench is our premier tool for crafting bespoke metrics and visualizations, to help elevate your Bitcoin, Ethereum, and crypto market analysis. This month we released 30x new Workbench Constructions for:
Bitcoin: Realized and Unrealized Profitability
Bitcoin: Pricing Models
Bitcoin: MVRV Suite
Ethereum: MVRV Suite
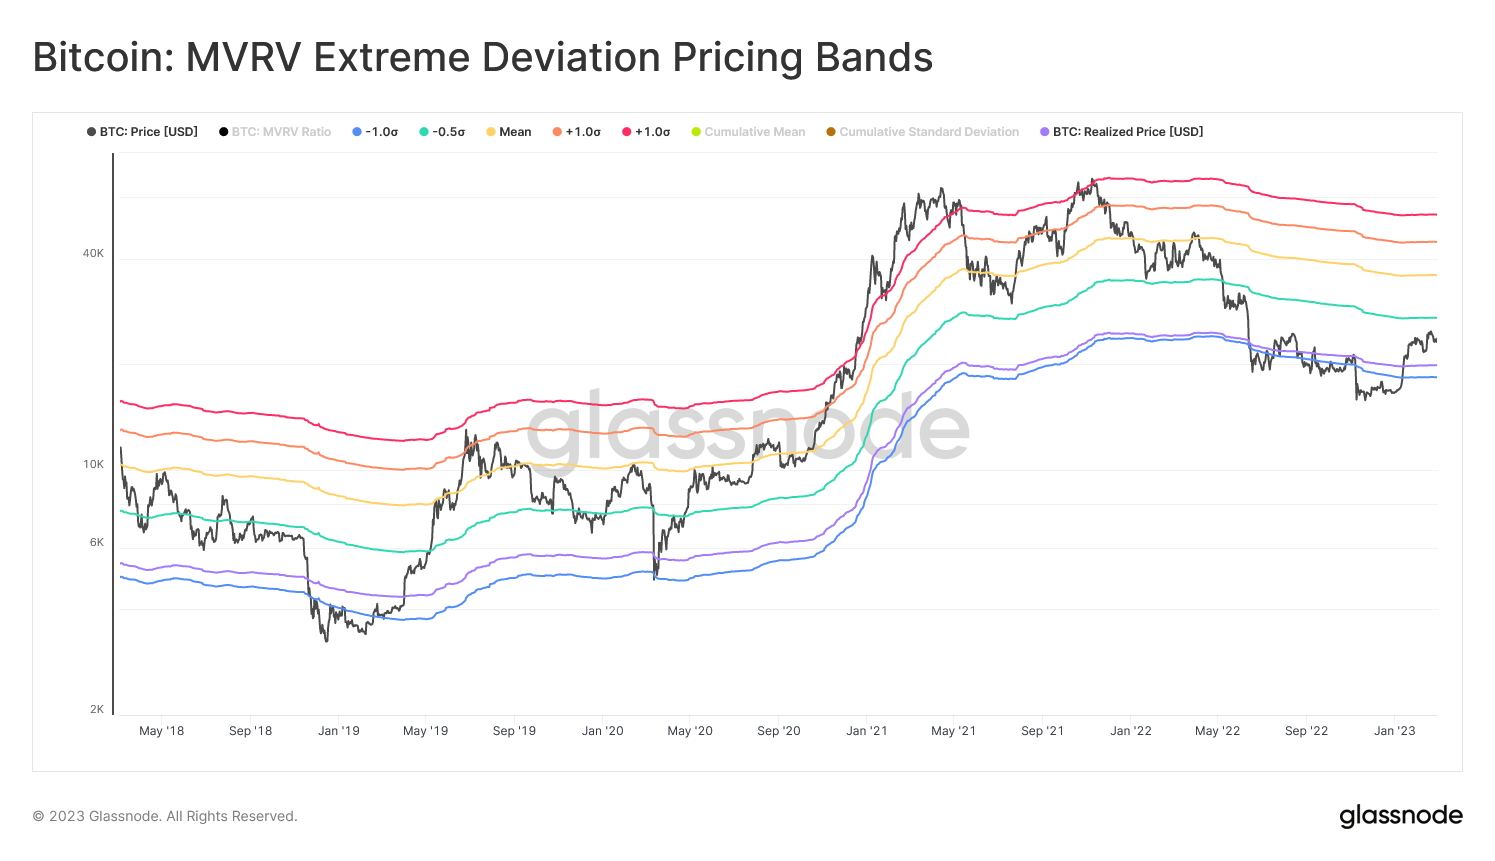
Construction of the Month: Bitcoin: MVRV Extreme Deviation Pricing Bands
This chart presents pricing bands derived from the MVRV Ratio based on the degree of deviation from the all-time mean. Upper and lower bands are computed from levels representing +/- 0.5 to 1.0 standard deviations. The following market cycle phases are presented:
- 🔵 -1.0σ
- 🟢 -0.5σ
- 🟡 Mean
- 🟠 +0.5σ
- 🔴 1.0σ
For full details on the derivation of these models, please refer to our report Mastering MVRV and the associated dashboard.
Disclaimer: This report does not provide any investment advice. All data is provided for information and educational purposes only. No investment decision shall be based on the information provided here and you are solely responsible for your own investment decisions.

Source: https://insights.glassnode.com/february-2023-product-update/