A review of Credit Derivatives (CRD) volumes and market share at Clearing Houses (CCPs) in 2Q 2023.
- Index, Single-name and Swaptions
- Overall volumes in 2Q23 were down
- In USD, CDX volumes were down, while CDS were up
- In USD CDX, ICE Clear Credit had 97% share in the quarter
- In EUR, iTraxx volumes were down, while CDS were up
- In EUR iTraxx and CDS, ICE Clear Europe down ahead of it’s closure
- Both LCH CDSClear and ICE Clear Credit gaining, the former gaining more
- Swaptions volume in both EUR & USD
- JPY Volumes at JSCC
All the charts and detail from CCPView.
USD CDX, CDS and Swaptions
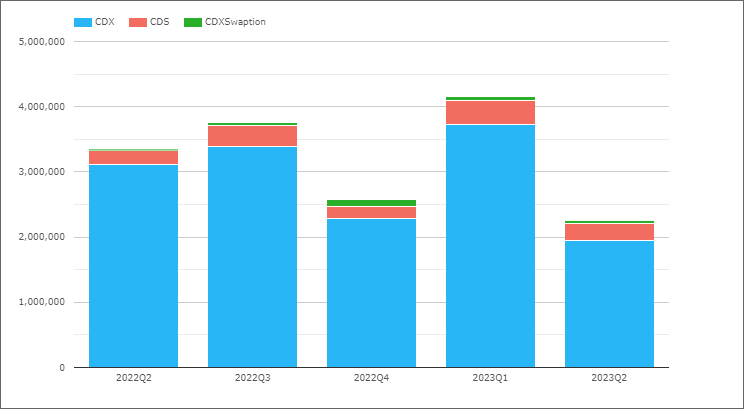
- USD CDX 2023Q2 volume of $1.95 trillion, down from $3.1 trillion in 2022Q2
- USD CDS 2023Q2 volume of $262 billion, up from $219 billion in 2022Q2
- USD CDXSwaptions 2023Q2 volume of $40 billion, up from $19 billion
CDX volumes significantly down compared to all the prior quarters shown.
Market Share of USD CDX
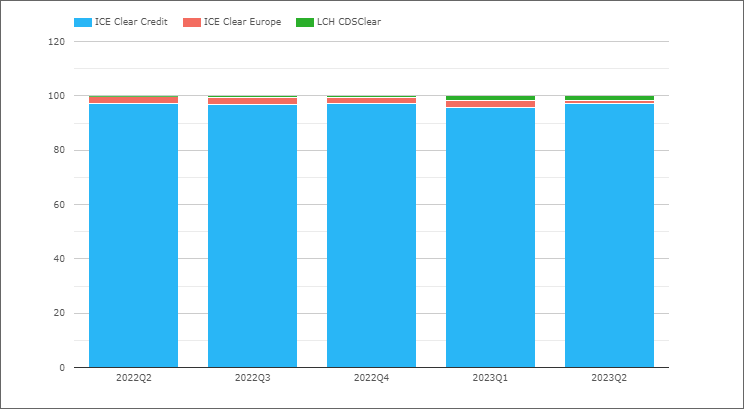
- ICE Clear Credit with 97.1% in 2023Q2, similar to 97.2% in 2022Q2
- LCH CDSClear with 1.9% in 2023Q2, up from 0.4% in 2022Q2
- ICE Clear Europe with 1.1% in 2023Q2, down from 2.4% in 2022Q2
The upcoming ICE Clear Europe shutdown later in 2023, resulting in it’s significantly reduced share and a gain for ICE Clear Europe.
Market Share of USD CDS (single-name)

- ICE Clear Credit with 86% in 2023Q2, down from 96.9% in 2022Q2
- ICE Clear Europe with 10.5% in 2023Q2, up from 2.9% in 2022Q2
- LCH CDSClear with 3.4% in 2023Q2, up from 0.2% in 2022Q2
The ICE Clear Europe share of 10.5% is from $27.6 billion gross notional in the quarter, while prior quarters were in the $2 billion to $6 billion range, so this figure looks like an anomaly, possibly due to volume resulting from transfer out, as the outstanding notional at ICE Clear Europe decreased $4 billion in the 2023Q2 quarter.
Compare this to the LCH CDSClear increase in outstanding notional of $724 million in the same quarter from the $9 billion volume (3.4%) and the ICE Clear Credit outstanding notional of $433 billion with volume of $226 billion in the quarter.
USD CDXSwaptions volume of $40.1 billion, is all at ICE Clear Credit.
EUR CRD Index, CDS and Swaptions
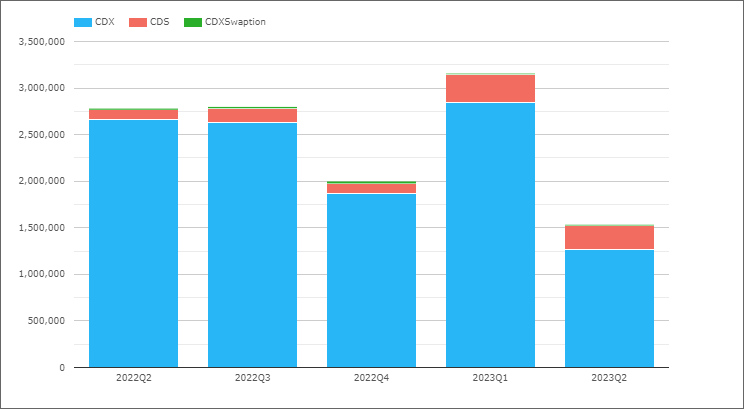
- EUR iTraxx 2023Q2 volume of €1.26 trillion, is down from €2.66 trillion in 2022Q2
- EUR CDS 2023Q2 volume of €260 billion, is up from €103 billion in 2022Q2
- EUR iTraxxSwaptions 2023Q2 volume of €9.5 billion, down from €15 billion in 2022Q2
EUR index volumes massively down, while single-name are up, similar to what we saw in USD, though the single-name increase is higher in EUR, possibly due to continuing higher activity resulting from stress in the European banking sector.
Market Share of EUR iTraxx
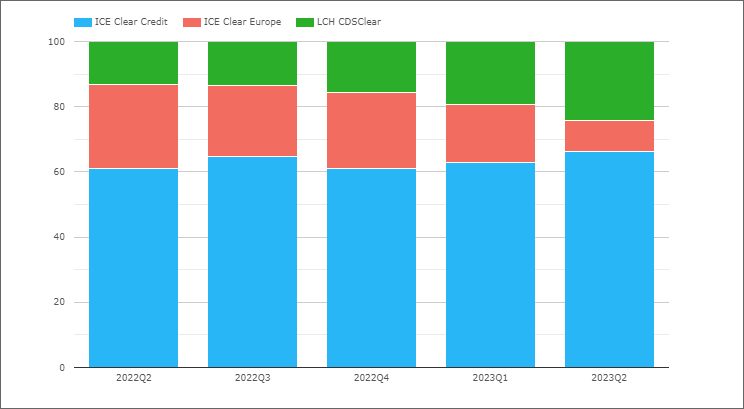
- ICE Clear Credit with 66.2% in 2023Q2, up from 60.9% in 2022Q2
- LCH CDSClear with 24.1% in 2023Q2, up from 13.1% in 2022Q2
- ICE Clear Europe with 9.7% in 2023Q2, down from 26% in 2022Q2
ICE Clear Europe share down aheads of its upcoming closure and on the face of it LCH CDSClear gaining more of this voulme than ICE Clear Credit, as it added 11% from a year earlier to get to 24.1% in 2023Q2, while ICE Clear Credit added 5.3%. A two to one ratio of where ICE Clear Europe volume is moving? One to watch in subsequent months to see where it ends up.
Market Share of EUR CDS (single-name)
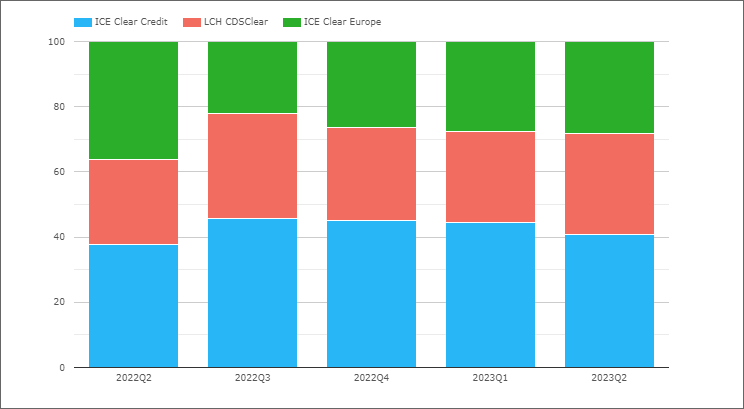
- ICE Clear Credit with 40.7% in 2023Q2,up from 37.9% in 2022Q2
- LCH CDS Clear with 31.1% in 2023Q2, up from 26% in 2022Q2
- ICE Clear Europe with 28.2% in 2023Q2, down from 36.1% in 2022Q2
So similar to ITraxx, we see ICE Clear Europe down and both LCH CDSClear and ICE Clear Credit up, though this time the pick in percent share is 5.1% to 2.8%, so less than a 2 to 1 ratio.
EUR iTraxxSwaptions volume of €9.65 billion in 2023Q2, is from LCH CDSClear with €9.53 billion and ICE Clear Credit with €121 million.
JPY CDX and CDS
And for our final chart, JPY CDX and CDS volumes.
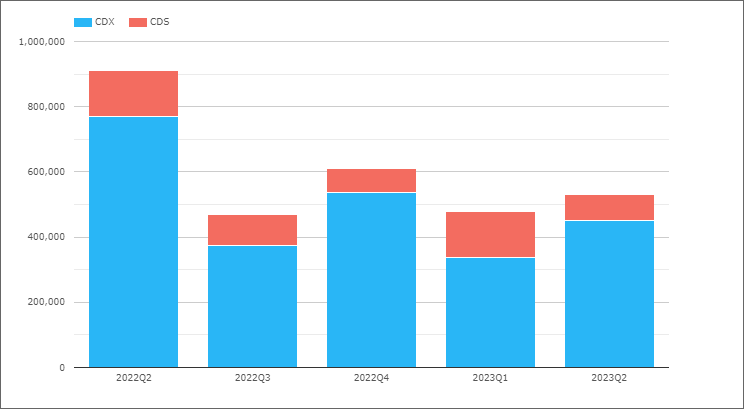
- JPY CDX volume in 2023Q2 was Y452 billion, down from Y770 billion in 2022Q2
- JPY CDS volume in 2023Q2 was Y79 billion, down from Y141 billion in 2022Q2
- All the volume is at JSCC.
That’s It
Seven charts to cover CRD.
There is a lot more data in CCPView.
Daily, weekly, monthly, quarterly or annual.
Volume, ADV, Open Interest, OI Change.
More granular data at Index Series and Single-name level.
Please contact us if you are interested in a subscription.