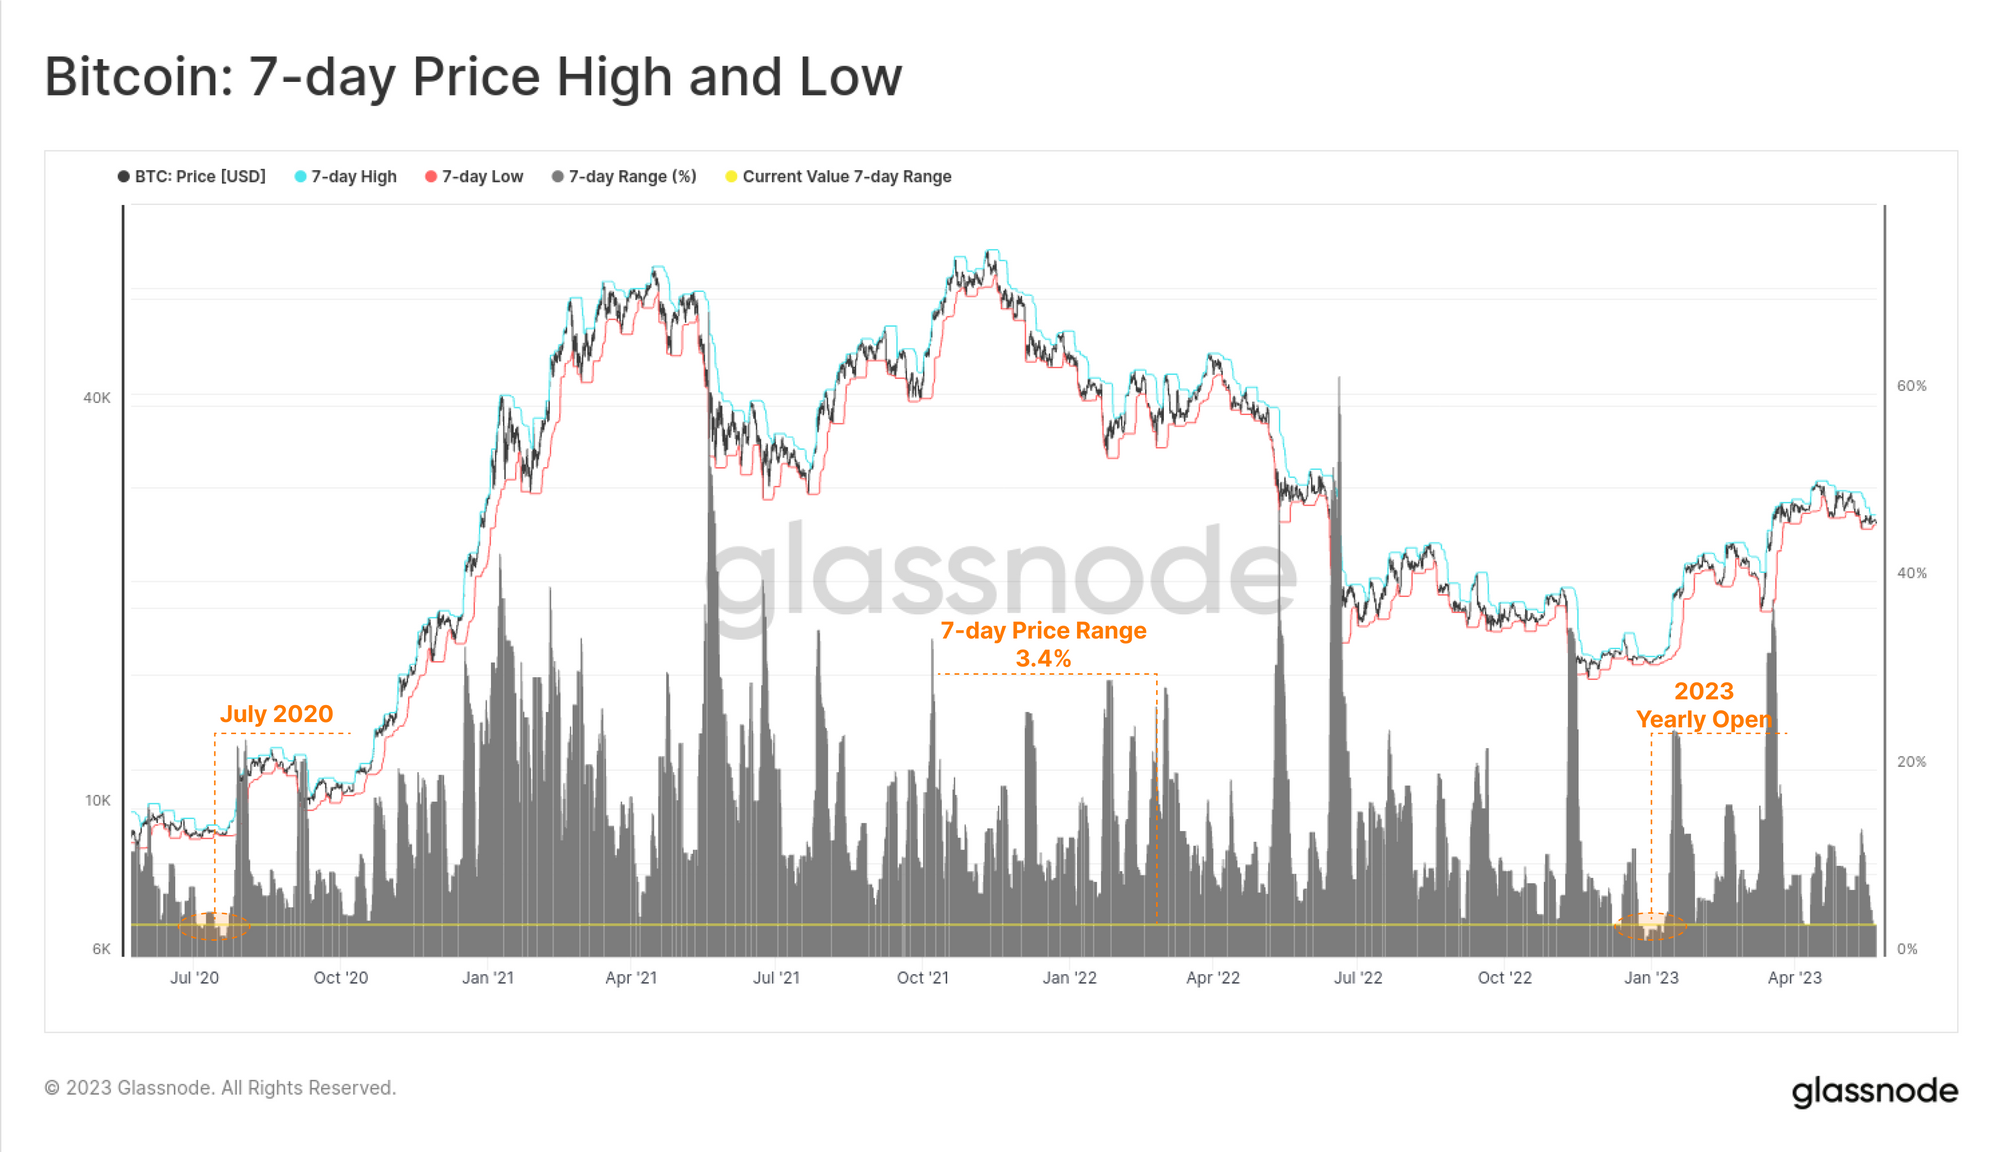
The Bitcoin market has consolidated this week, trading within a relatively narrow 3.4% price range, with a low of $26.6k and high of $27.5k. In fact, this has been one of the tightest trading ranges over the last few years, with the last examples being the 2023 yearly open, and July 2020 after the recovery from the COVID sell-off.
This comes alongside extremely light on-chain volume, with aggregate, entity-adjusted, and exchange related flows remaining at cyclical lows. Meanwhile, large swathes of the coin supply remain dormant in investor wallets, with several key age bands hitting all-time-highs.
In this edition, we will explore this interesting state of play, and what it tells us about investor confidence, incentives, and perspective on the 2023 market.
💡
cummax(m1,7) function to establish rolling 7-day upper and lower price range bands.🪟 View all charts covered in this report in The Week On-chain Dashboard.
Volume Down
In last weeks edition, we shows how on-chain activity for Bitcoin has reached historical highs for metrics such as Transaction counts, largely related to ordinals, inscriptions, and BRC-20 tokens. These types of transactions tend to represent relatively small BTC volumes however, with ordinals often transferred alongside a small volume of BTC (usually around 10k sats = 0.0001 BTC).
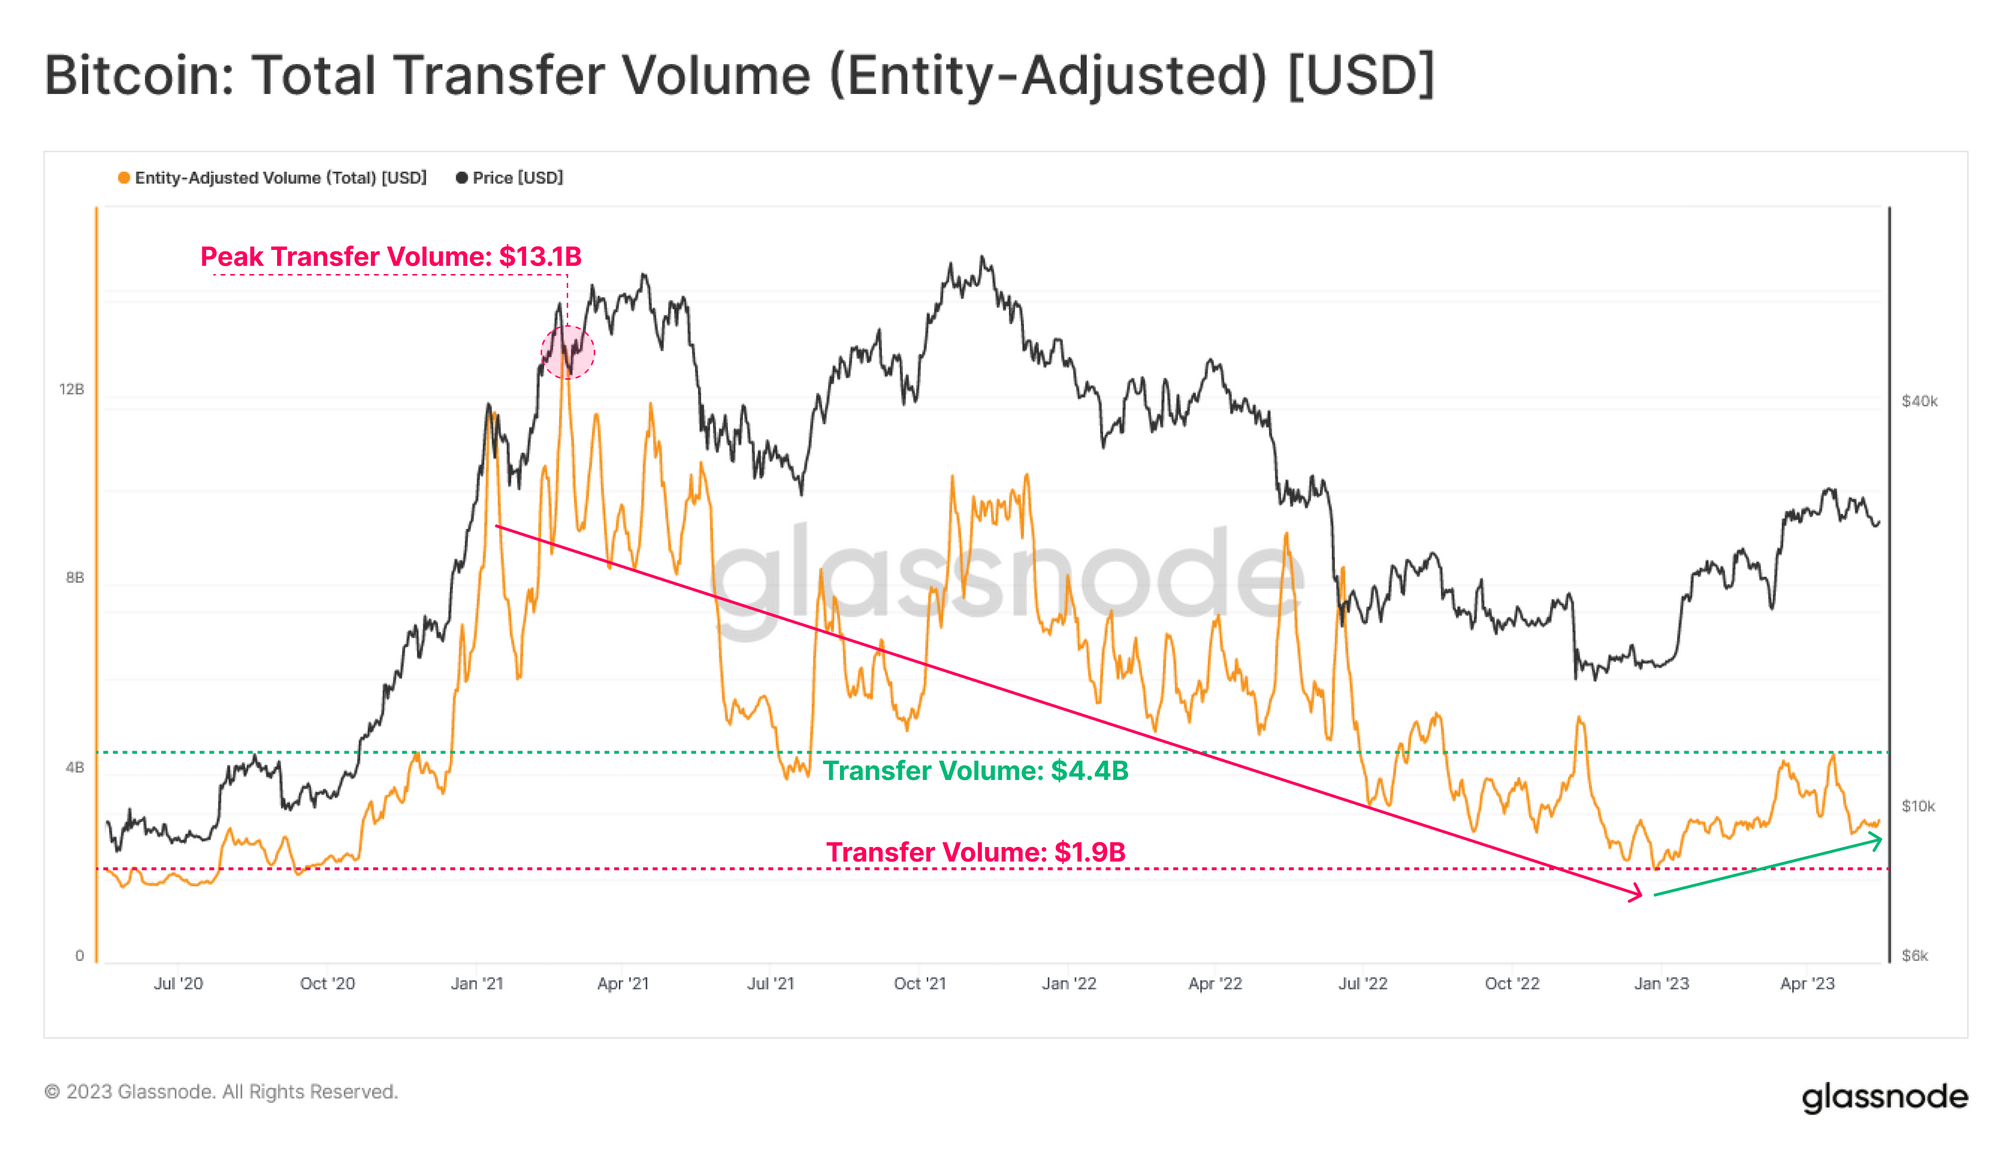
Assessing the Transfer Volume settled by the Bitcoin network across the last three years, we note a large decline in overall economical throughput since early 2021, falling from a cycle high of $13.1B to a cycle low of $1.9B, a 85.5% decline. Transfer volumes have experienced a marginal uplift in 2023, however remain near cycle lows between $1.9B and $4.4B.
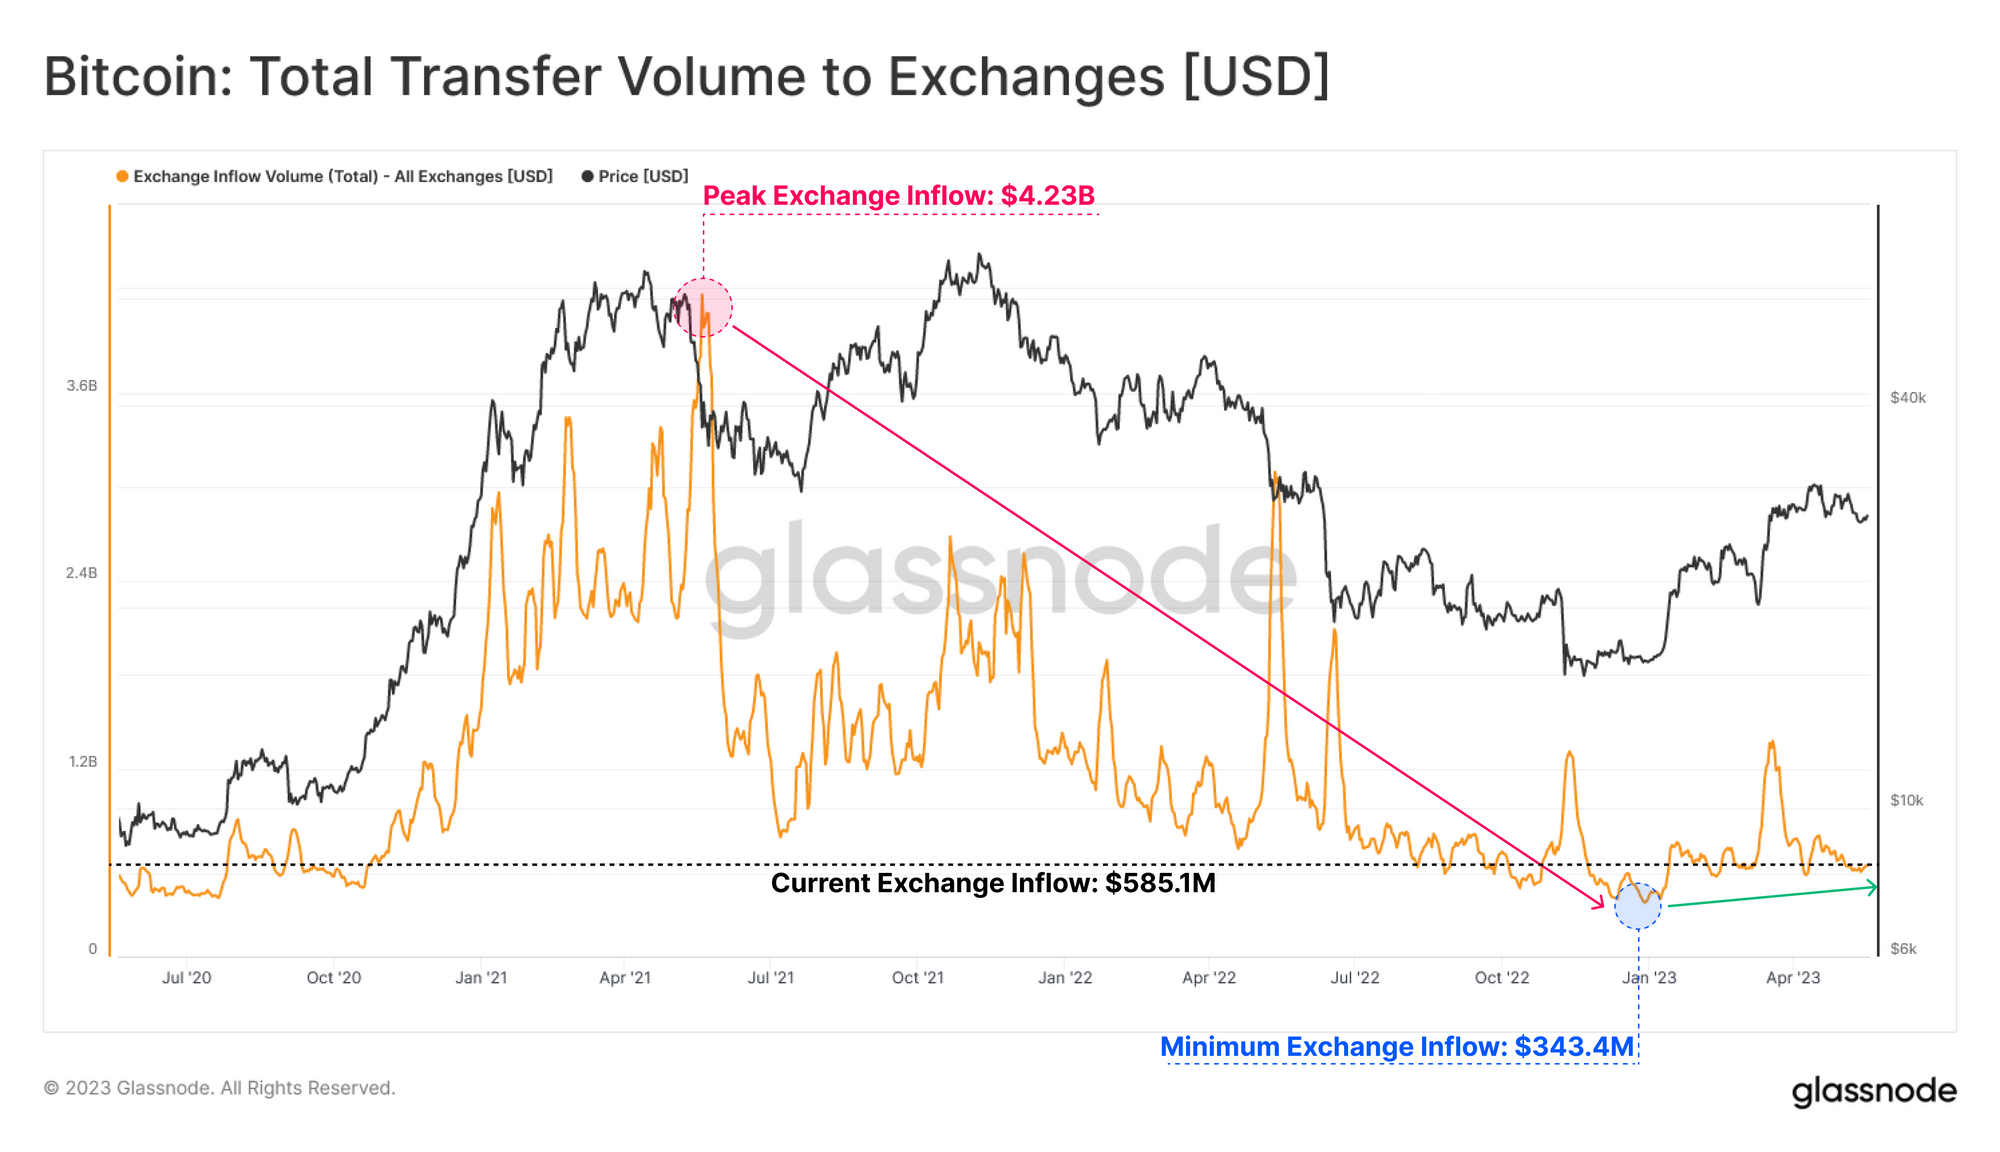
Exchanges remain a centerpiece for BTC trade, and studying the flows in and out provides a robust proxy for trade volume, awareness, speculation demand, and investor confidence. We see a similar structural decline in exchange deposit volume, declining from a peak of $4.2B in May 2021 to a low of $343.4M today (-91.8%).
⚠️
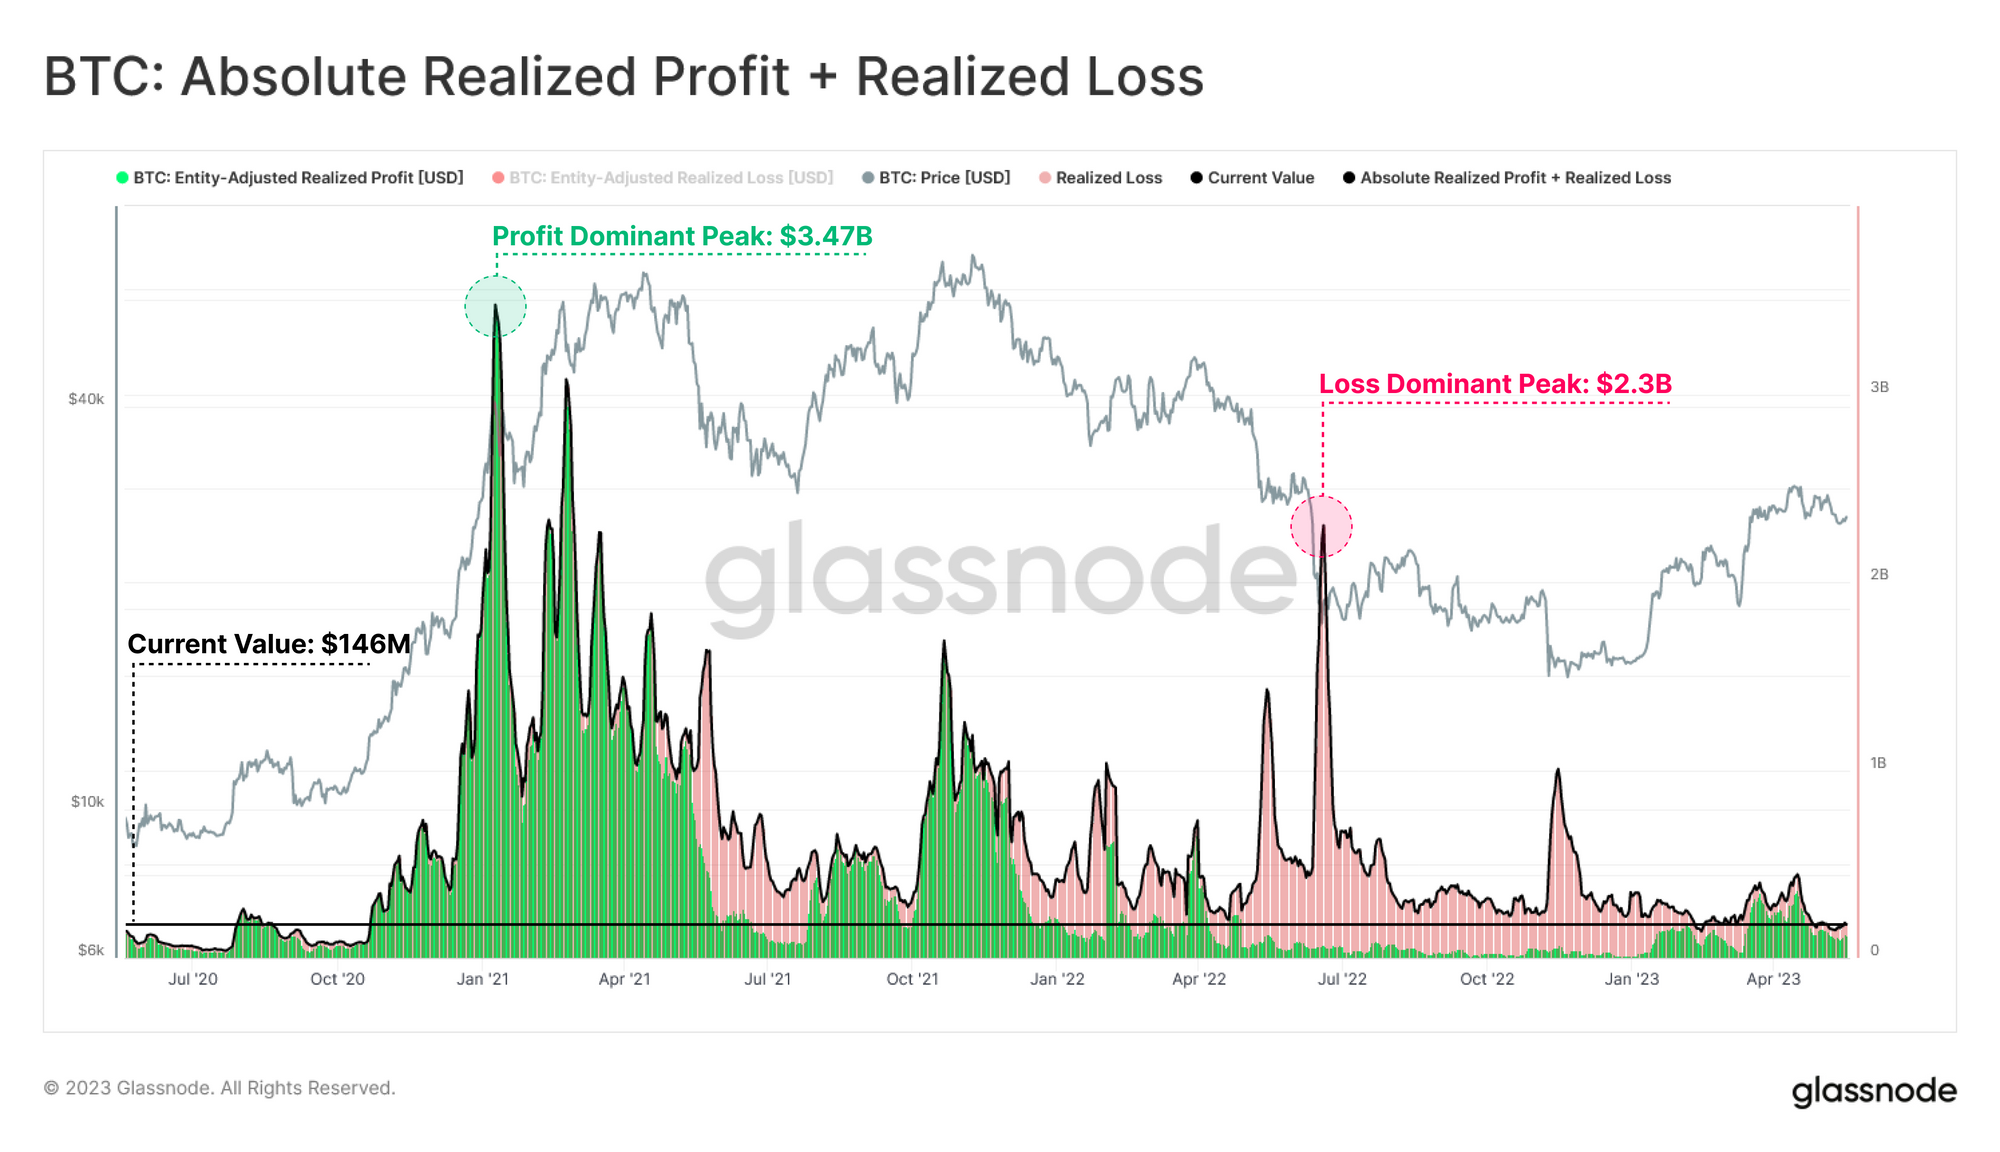
Another useful proxy for assessing network utilization is the absolute value of Realized Profit and Loss events. This provides insight into the capital flows in or out of the asset, as coins are revalued higher, or lower. The combined Realized Profit and Loss is trading around the lowest levels seen over the last 3 years.
This suggests that the majority of holders with large profits, or losses, are unwilling to spend.
Unrealized Potential
We have established that both the nominal and realized network throughput remains cyclically low. This may be due to many market participants having a cost basis which is quite close to the current price, thus indicating there is minimal incentive to spend just yet. Participants may require greater volatility, in in either direction, to entice spending behavior.
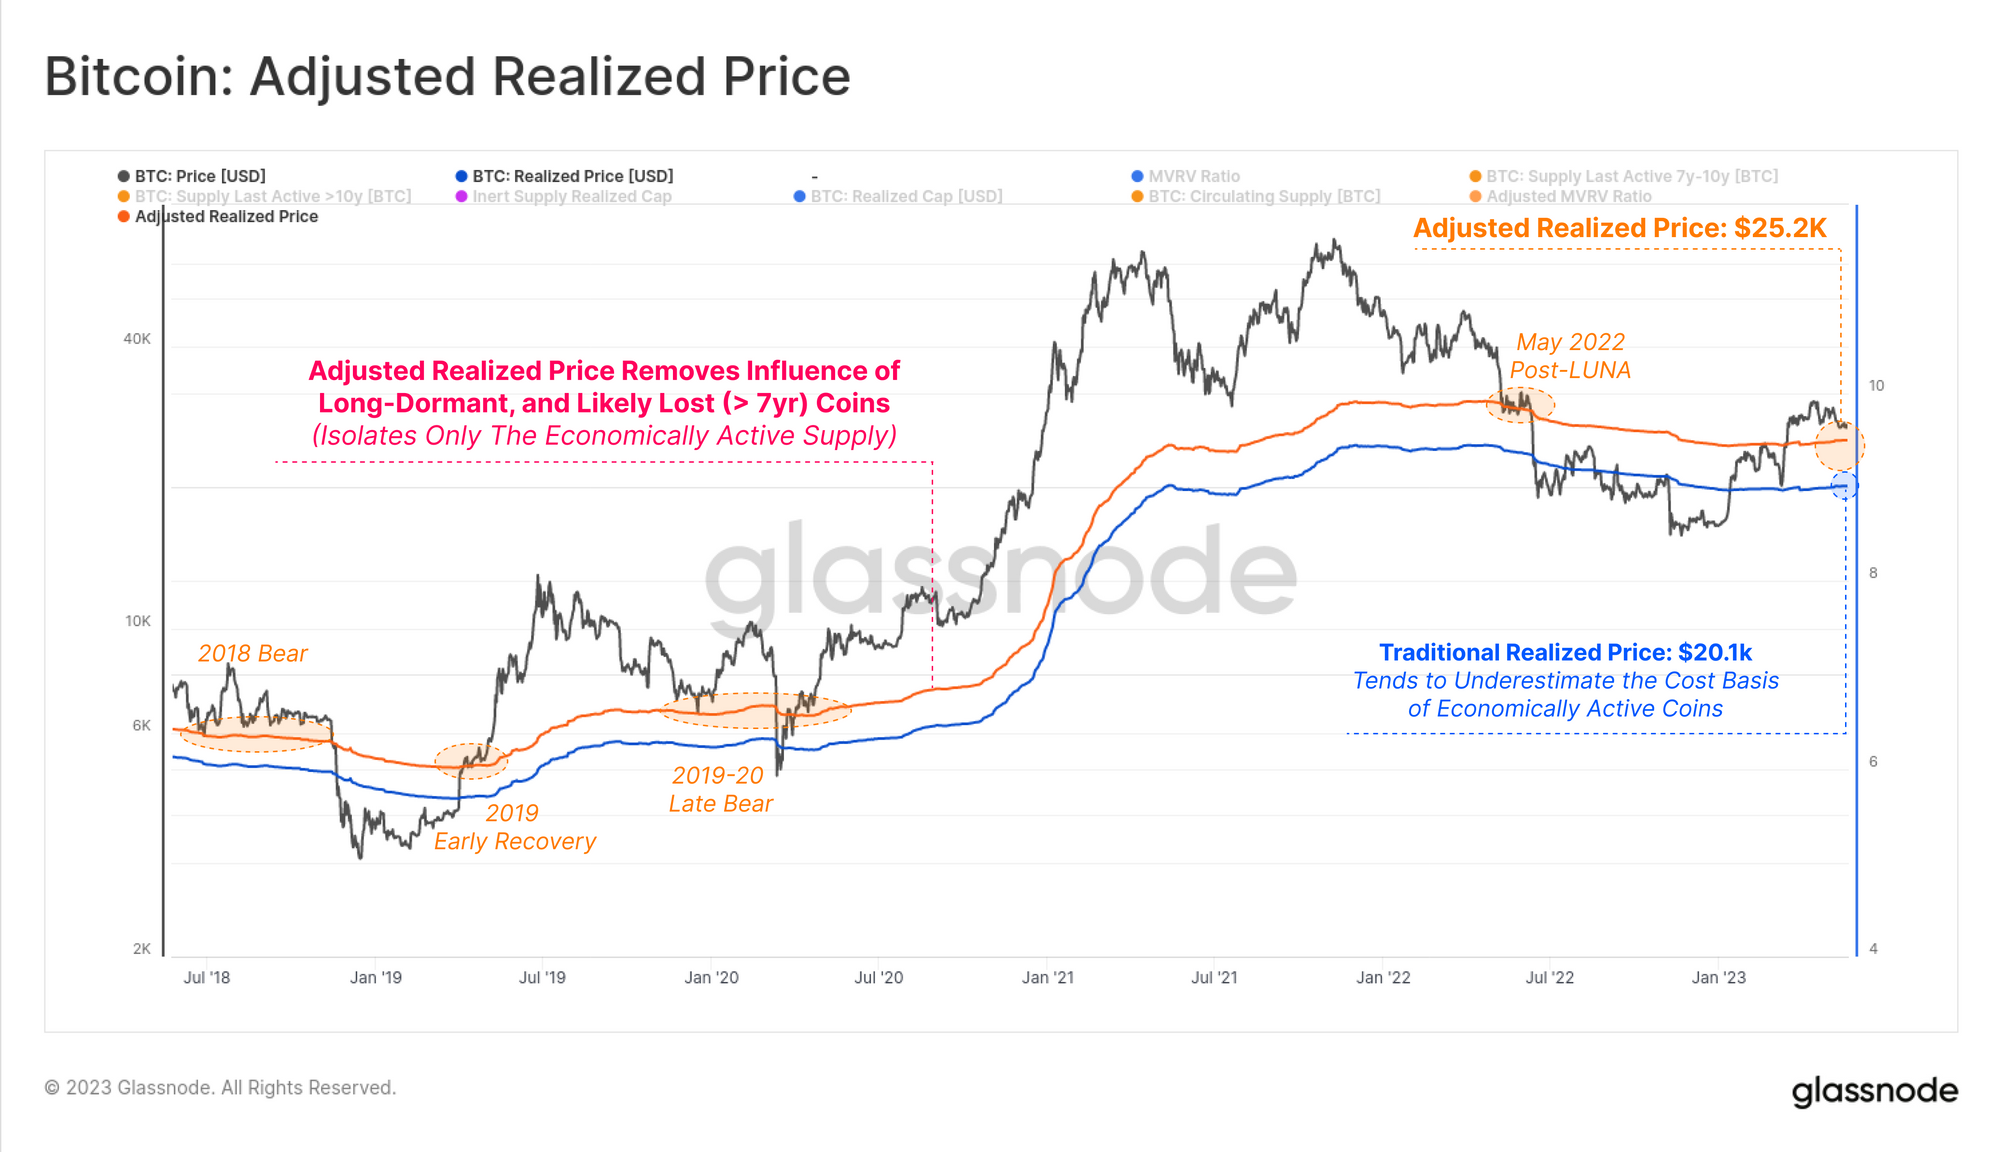
The Adjusted Realized Price provides an improved model for estimating this market wide cost-basis. It works by removing the tremendous unrealized profits held by long-dormant (and likely lost) coins (> 7y), isolating the economically active and more price sensitive cohort of holders.
Spot prices are currently trading just above the Adjusted Realized Price ($25.2k), which is likely a psychological area of interest in the event of a pullback. This also firms up the thesis that there is simply not a great deal of profit (or loss) available to be taken by the active participants in the market.
⚠️
Alert Idea: Price breaking below $25.2k would indicate a retest of the cost basis for the economically active supply is underway, being a key psychological price level to watch.
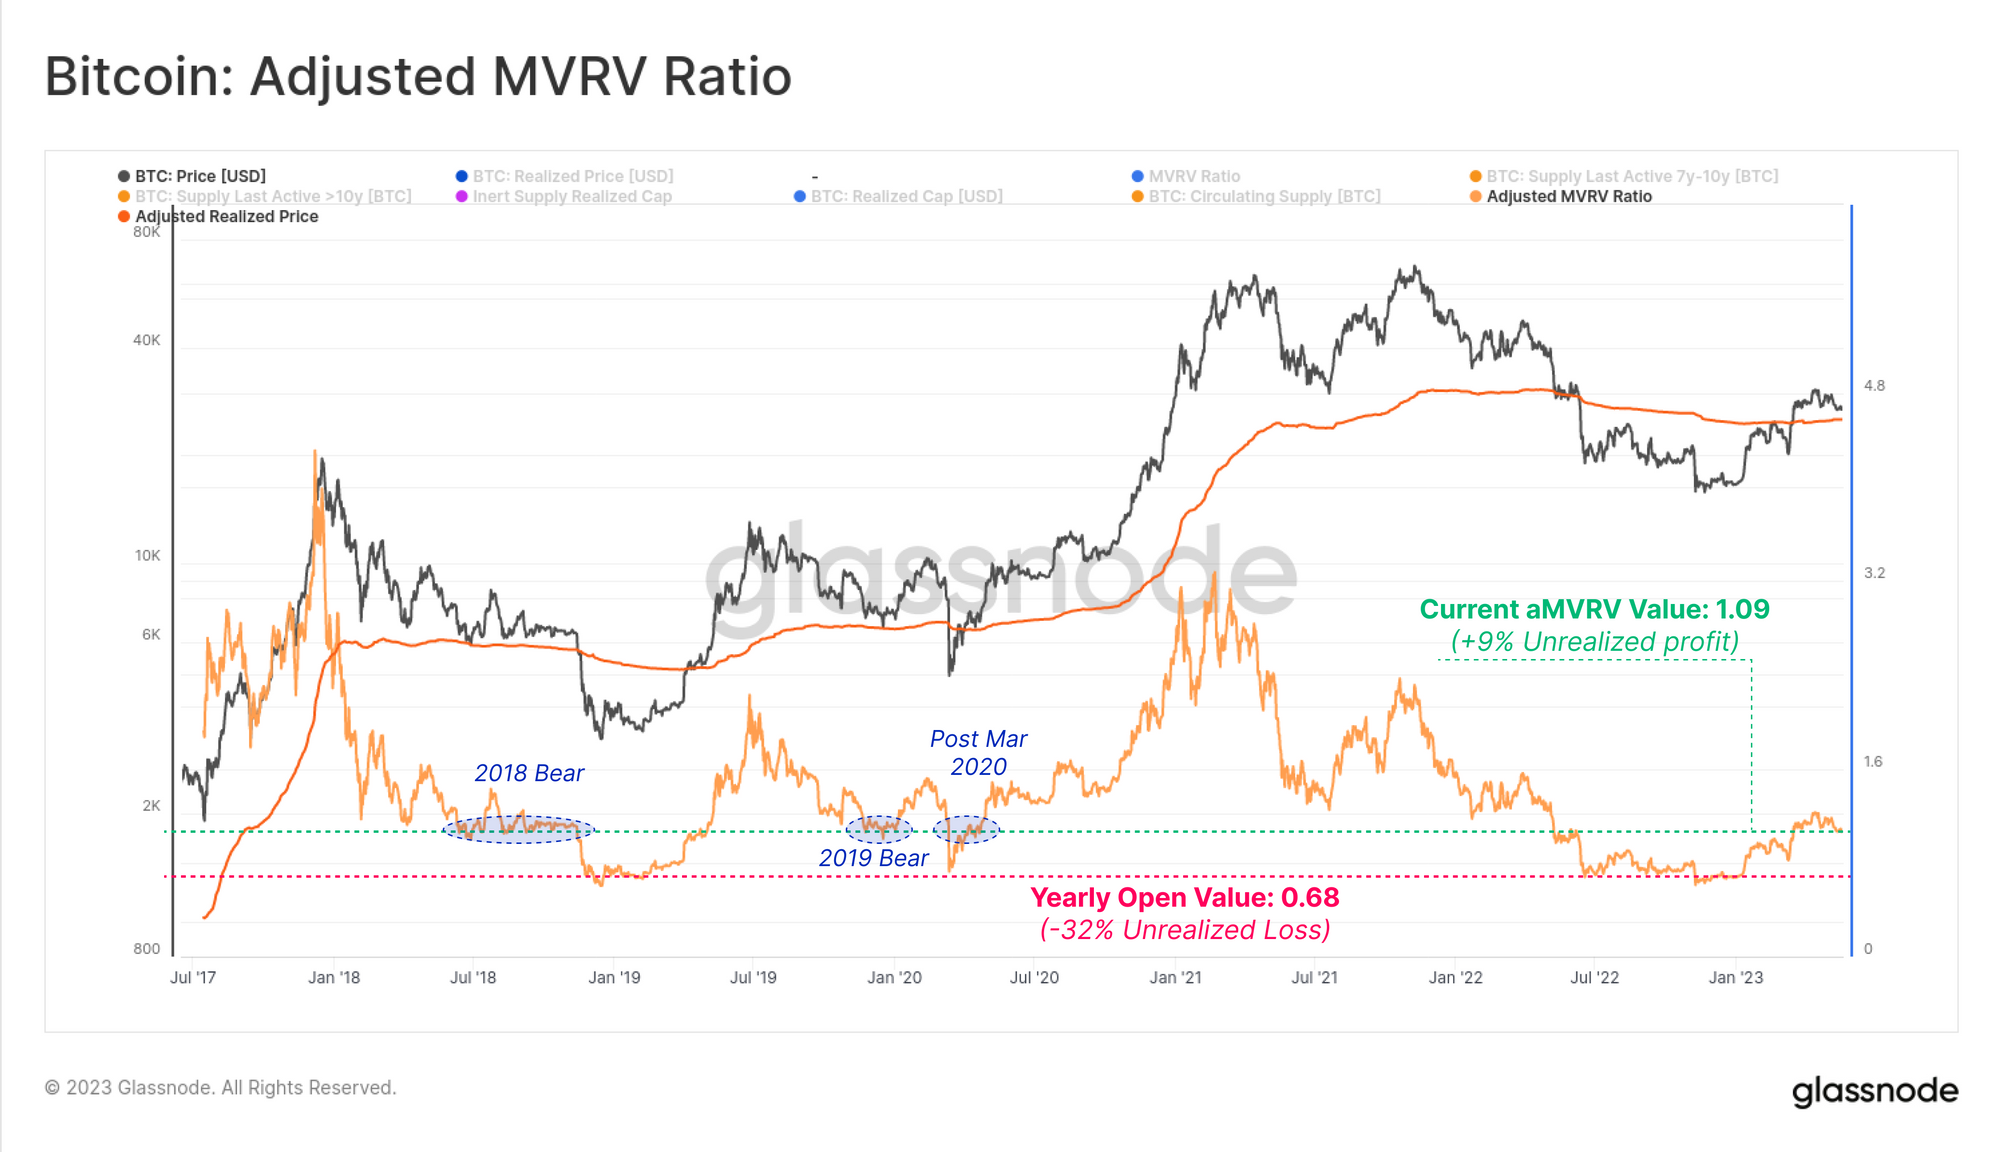
The recent rally above $30k saw the Adjusted MVRV Ratio rise to a value of 1.21, suggesting a fairly modest 21% unrealized profit level was reached.
Currently, the aMVRV is recording a value of 1.09, suggesting just 9% unrealized profit remains within in the market. This is coincident with what were historically oversold levels in both the 2018, 2019 and March 2020 cycle lows.
Supply Stays Still
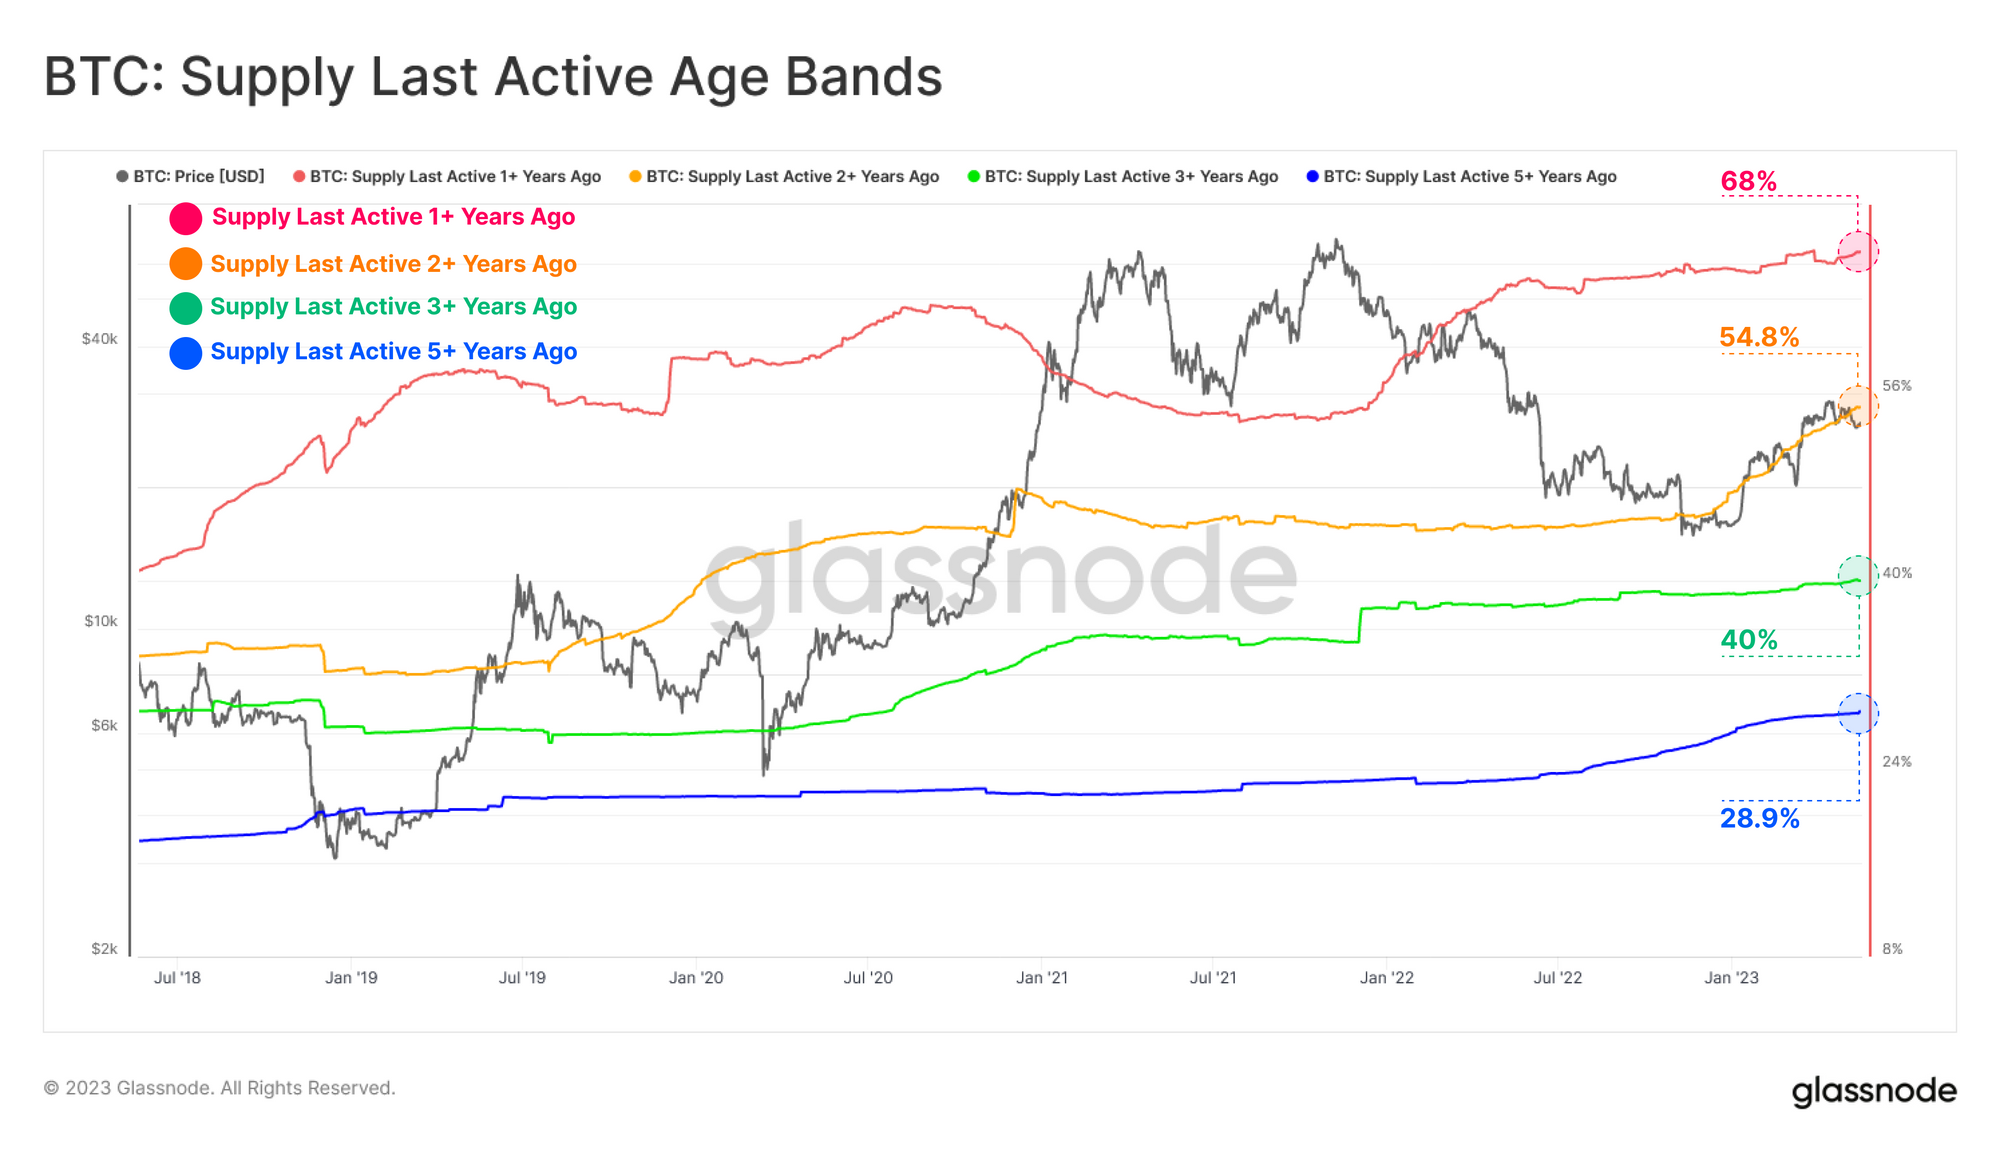
Despite the blistering start to the year across the digital asset landscape, the BTC supply held for longer than 1yr+ continues to push to new highs. The chart below shows four subsets of this dormant supply as a proportion of the total circulating supply:
- 🔴 Supply Last Active 1+ Yrs Ago: 68.1%
- 🟡 Supply Last Active 2+ Yrs Ago: 55.2%
- 🟢 Supply Last Active 3+ Yrs Ago: 40.0%
- 🔵 Supply Last Active 5+ Yrs Ago: 28.9%
The remarkable level of HODLing across the supply continues, with such high coin inactivity supporting the extreme lows of on-chain volume throughput.
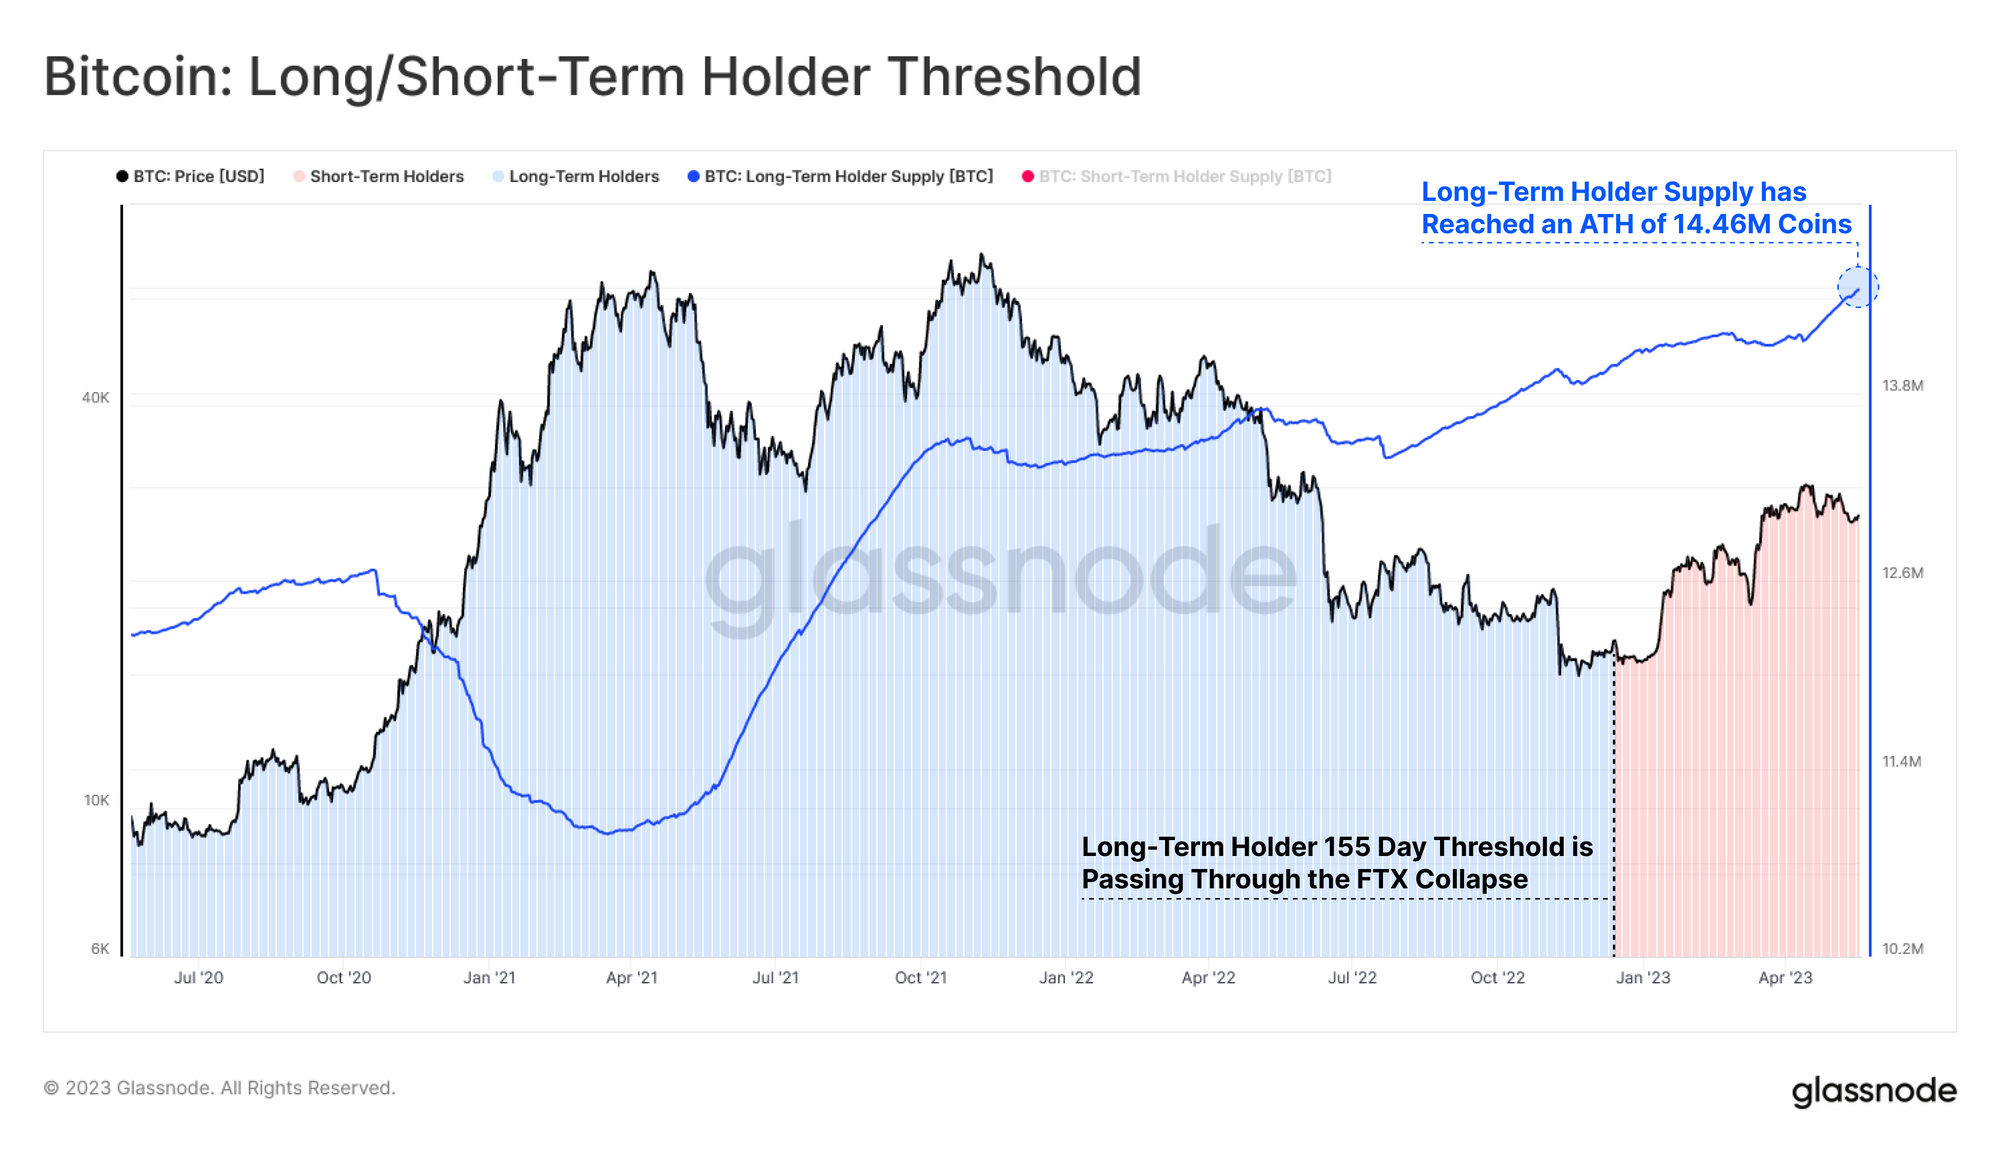
This phenomena is also reflected across Long-Term Holder Supply (coins held > 155-days), which is at a new ATH of 14.46M BTC. This reflects coins acquired immediately after the FTX failure maturing into LTH status.
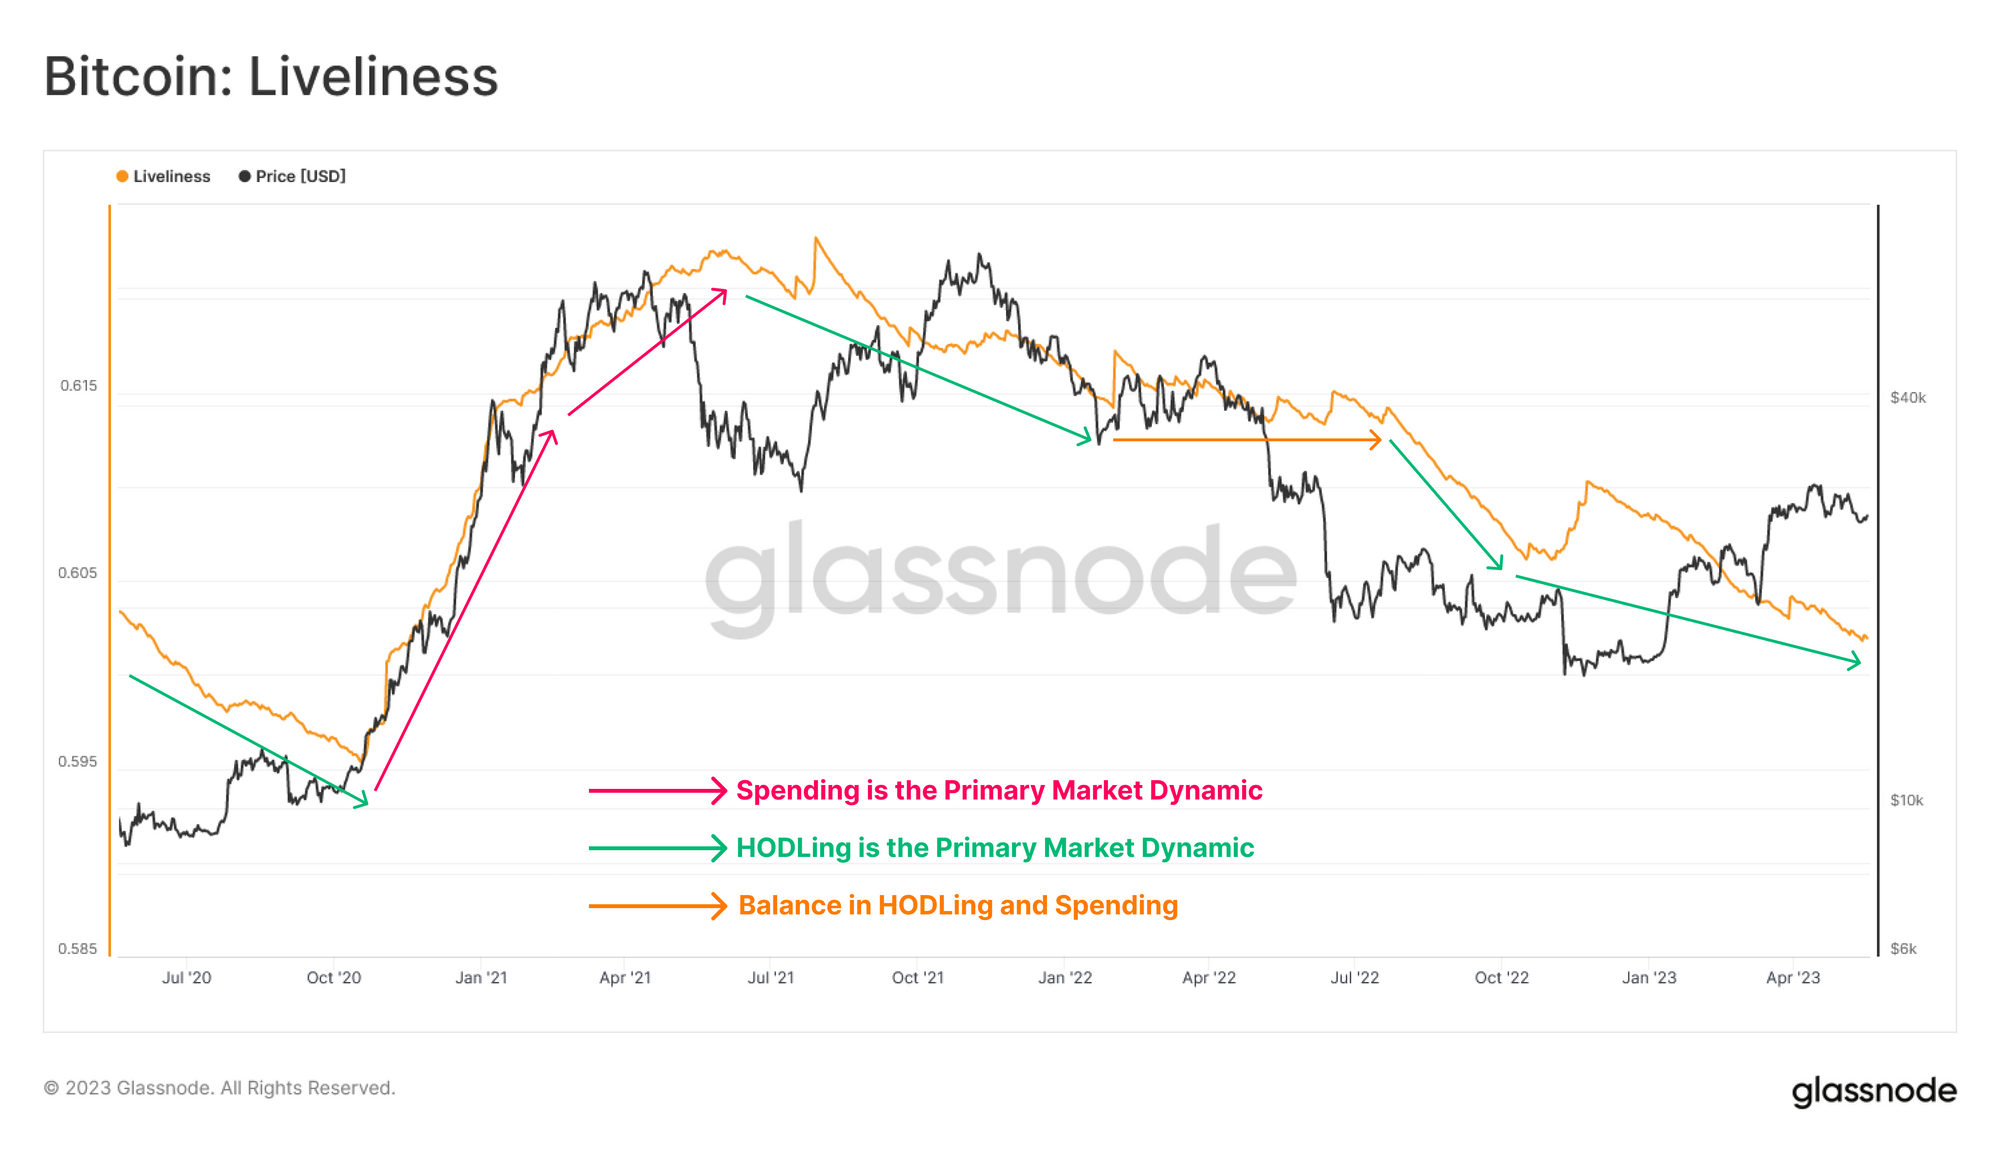
Confluence can be found in the Liveliness metric, which compares the relative balance between HODLing and spending behavior. Currently, network Liveliness is descending to the lowest value recorded since the Dec 2020 breakout above $20K. Persistent downtrends in Liveliness reaffirm that HODLing is certainly the current primary market dynamic across the majority of supply.
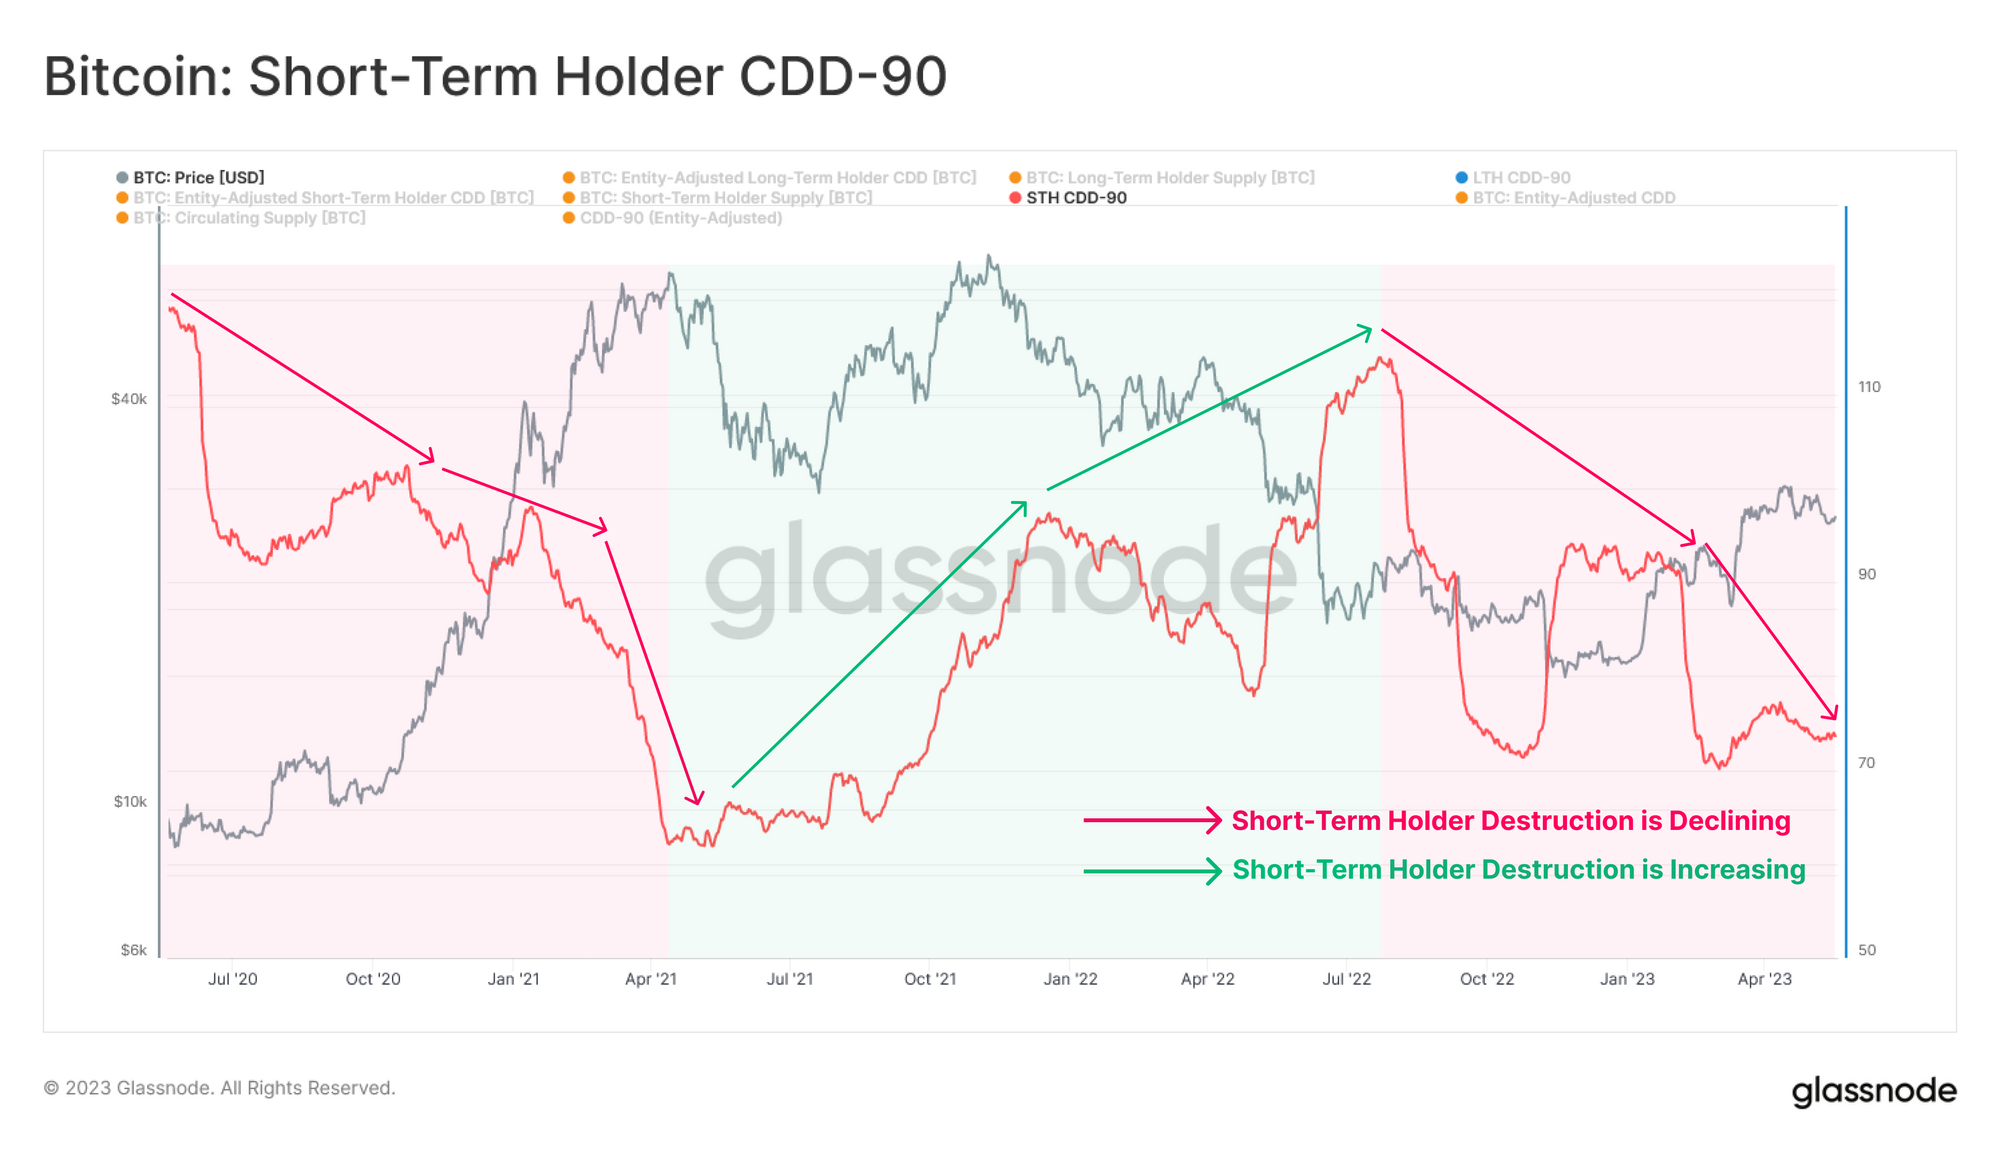
If we look to the Short-Term Holder (STH) cohort, we can assess the amount of ‘holding time’ being spent by this group (measured as coinday destruction over the last 90-days). By this metric, STH coinday destruction is extremely low, and significantly below the two large panic capitulation events occurring in June, and November 2022.
This infers that STHs are generally reluctant to spend within the current price range, and require greater volatility, and likely higher prices (realizing profits) as an incentive.
Overall, these metrics paint a relatively constructive view of Bitcoin holder conviction, where most are simply not interested in spending their coins just yet.
Holders From Last Cycle Are Forged
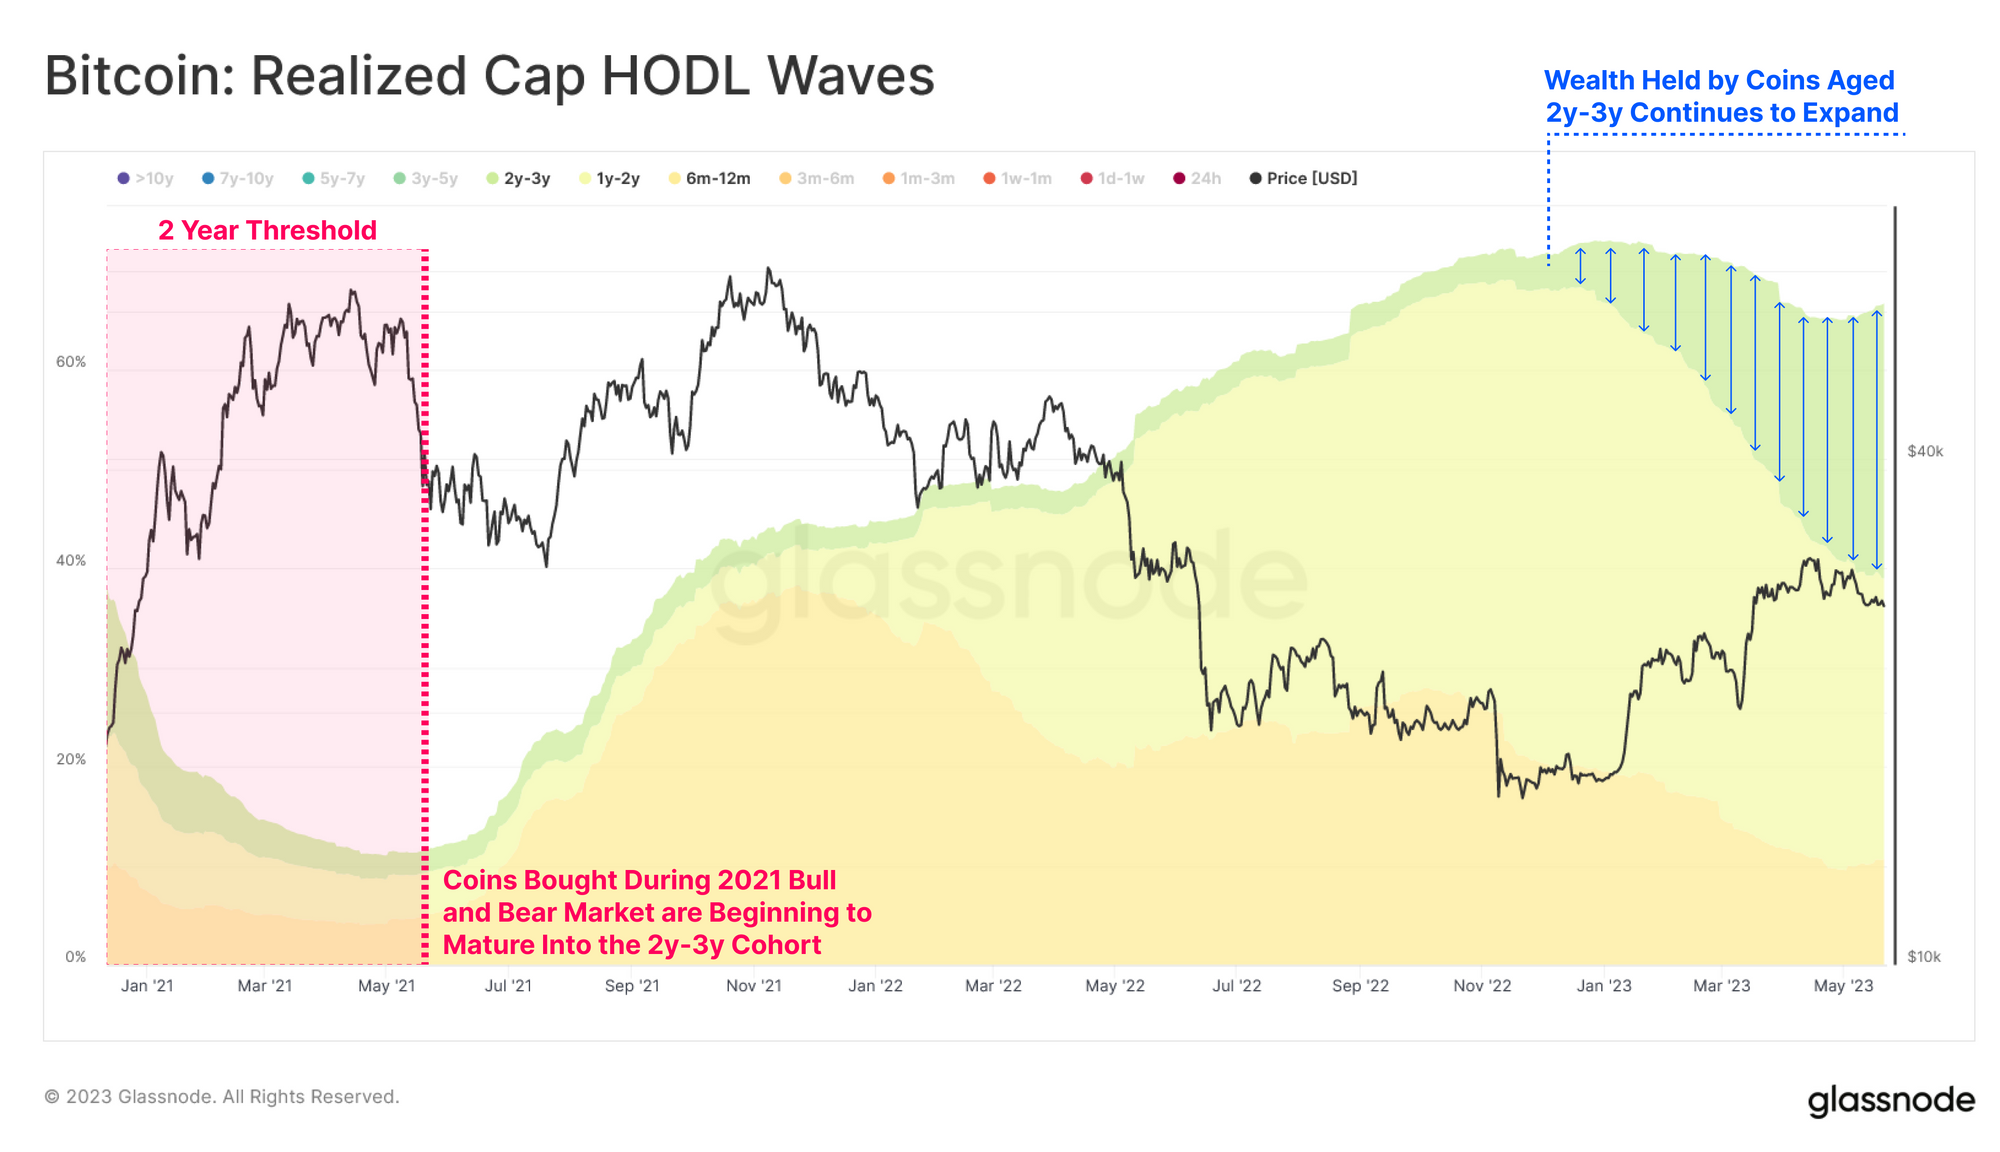
Following the November low, the USD denominated wealth held within coins aged 2y-3y has expanded from 3.1% to 27.7%, as large swathes of supply mature across the 2yr boundary. This reflects supply that was acquired after the May 2021 sell-off from $56k to $29k.
The chart below shows the changing proportion of USD wealth held in these age bands:
- 🟢 Wealth Held by 2y-3y: 3.1% to 27.7% (up +24.6%)
- 🟡 Wealth Held by 1y-2y: 43.5% to 28.3 (down -15.2%)
- 🟠 Wealth Held by 6m-1y: 25.5% to 10.6% (down -14.9%)
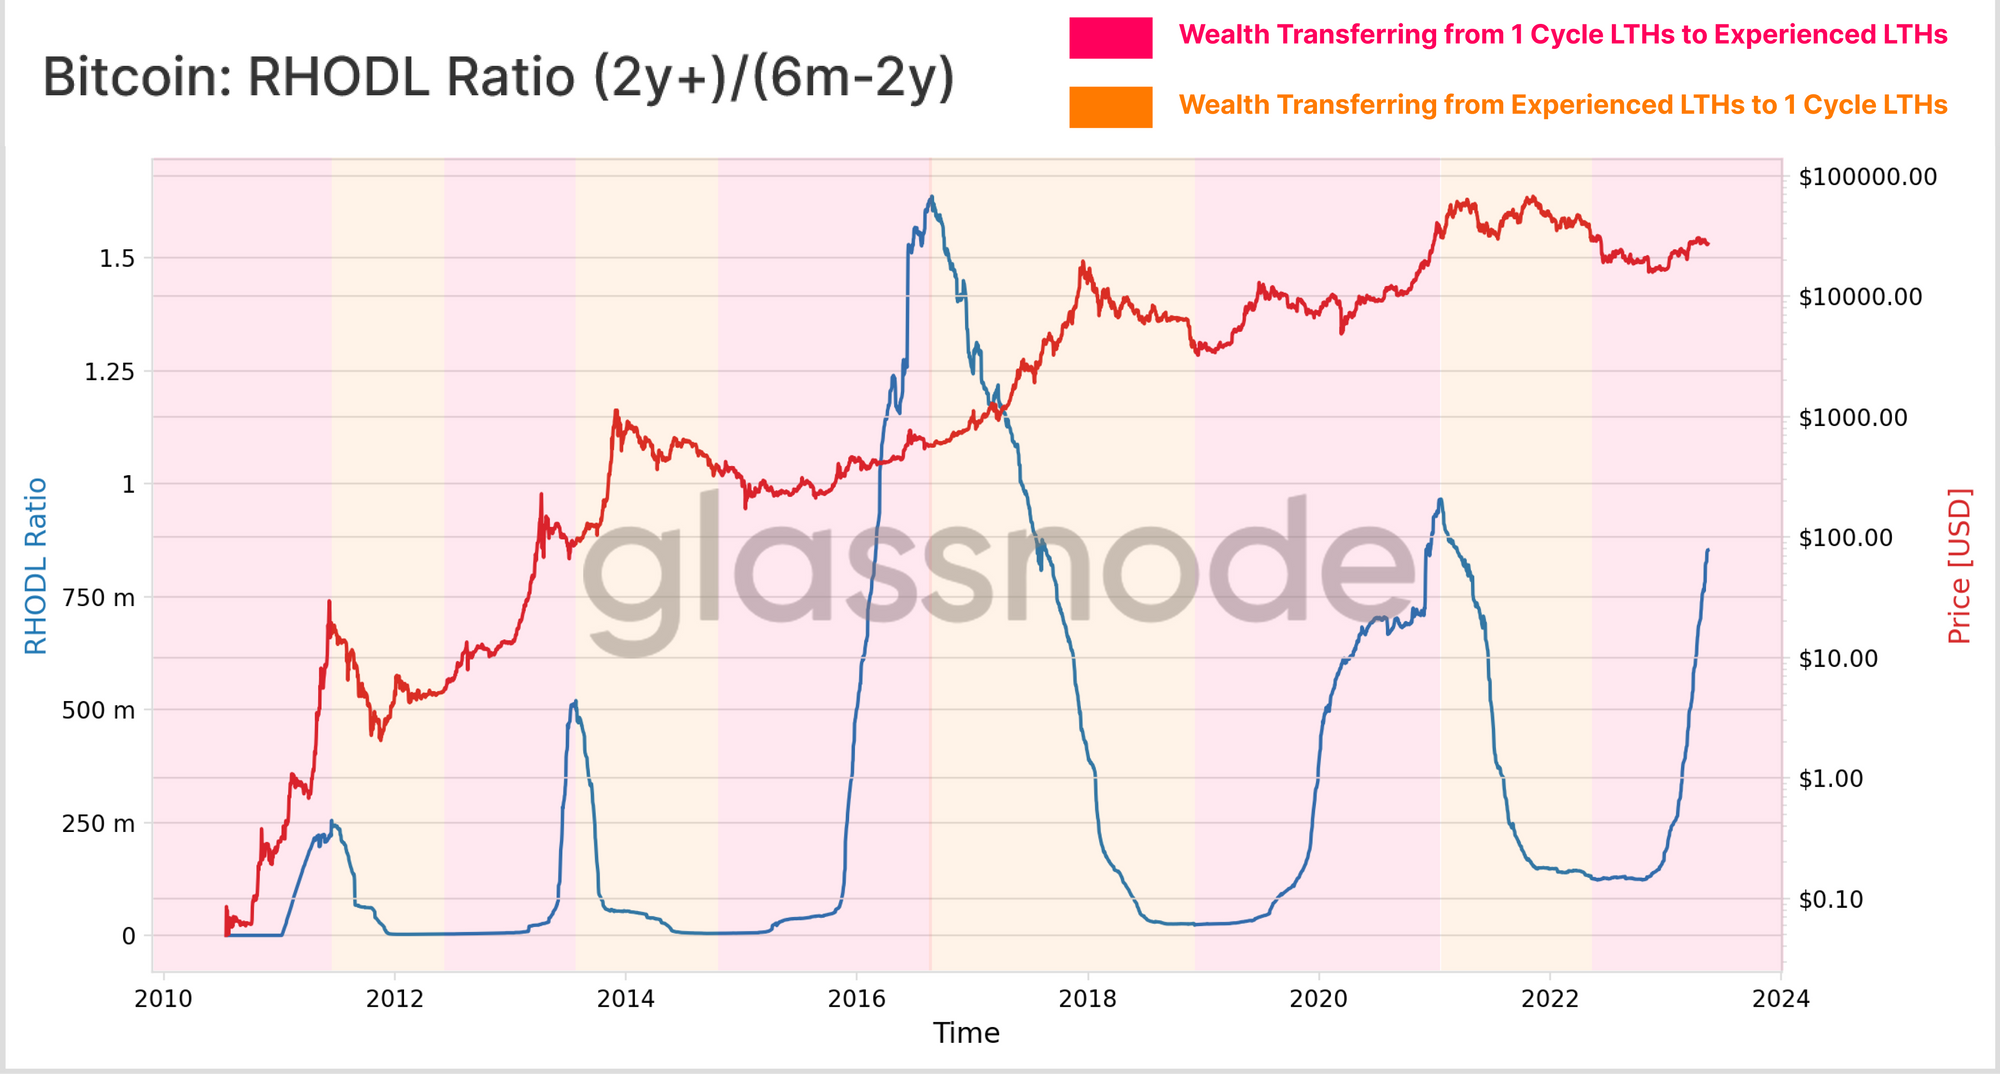
We can also utilize a new variant of the RHODL Ratio, comparing the wealth held in 2y+, to those in the 6m-2y age band. This helps us evaluate the balance between experienced (2yr+) and single cycle Long-Term Holders (6m-2y).
Currently, this RHODL variant is climbing exponentially, suggesting a significant portion of holders from the 2021-22 cycle are maturing into the experienced HODLers. Given the extraordinary, and mostly downside volatility experienced over this period, it demonstrates that the Bitcoin holder base remains incredibly resolute, which is a noteworthy, and likely constructive observation.
Summary and Conclusions
One of the great assets of on-chain analysis is our ability to observe both sides of holder behavior; their willingness to hold, and their willingness to spend. What we continue to observe is that the conviction of existing Bitcoin holders remains remarkably high, despite the extreme the volatility and immense deleveraging over the last 2yrs.
It is important to highlight that volume throughput is very low right now, indicating an arguably lackluster inflow of new demand, as well as growing dominance by low volume ordinal/inscription transactions. However, this is matched by an existing holder base who can be argued are increasingly price insensitive.
Given 2022 provided no shortage of reasons to panic, capitulate, and otherwise exit the market, the ageing of coins into multi-year age bands is noteworthy. It suggests a case where those who survived 2022, may require higher prices before opening up their cold storage wallets.
Disclaimer: This report does not provide any investment advice. All data is provided for information and educational purposes only. No investment decision shall be based on the information provided here and you are solely responsible for your own investment decisions.
. Join our Telegram channel.
. Visit Glassnode Forum for long-form discussions and analysis.
. For on-chain metrics, dashboards, and alerts, visit Glassnode Studio.
. For automated alerts on core on-chain metrics and activity on exchanges, visit our Glassnode Alerts Twitter.

Source: https://insights.glassnode.com/the-week-onchain-week-21-2023/