Key Technical indicators to watch
In our previous analysis, we observed that both the major support and resistance levels remain operative. Presently, Bitcoin is in a consolidation phase in the short term.
Taking a look at the 4-hour chart, we can note that Bitcoin has been on a downward trajectory since its peak at $31,000. The 55-period moving average constitutes a key resistance level, currently pegged at $27,042.
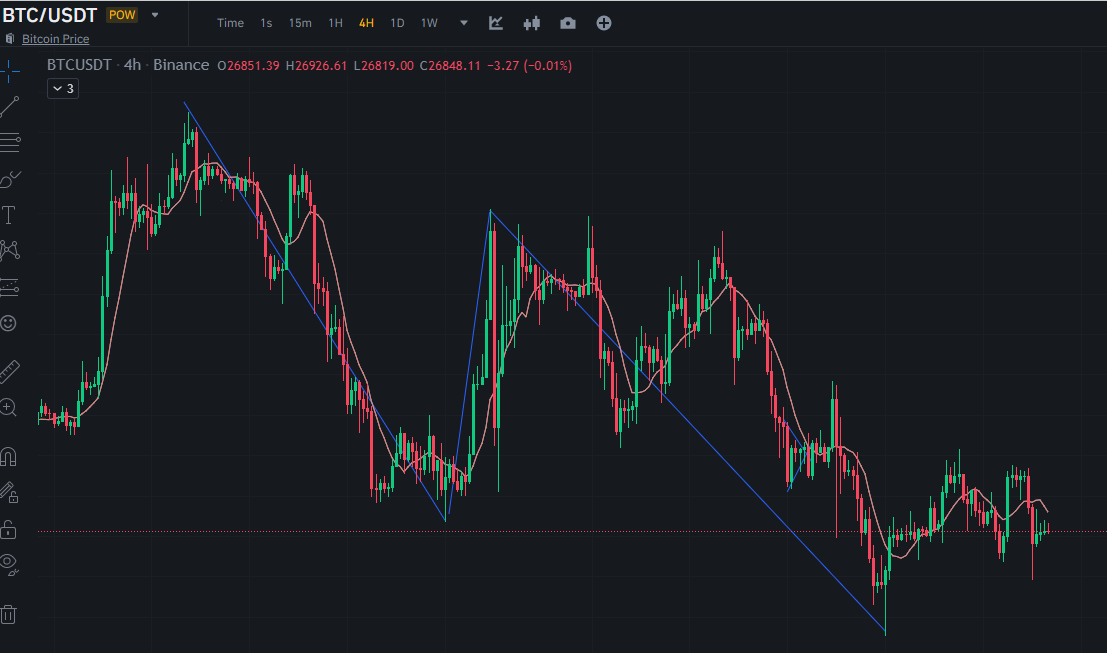
Source: Tradingview
Turning our focus to the daily chart, we find that the 89-period moving average stands as the principal support level, situated currently at $26,780.
Impending Altcoin Season
The BTC dominance chart presents an intriguing scenario – it appears to be forming a diamond top pattern. This pattern typically indicates an imminent, significant downtrend. In layman’s terms, we can infer that altcoins, especially those paired with Bitcoin like ADA/BTC and LINK/BTC, may outperform Bitcoin in the near future.
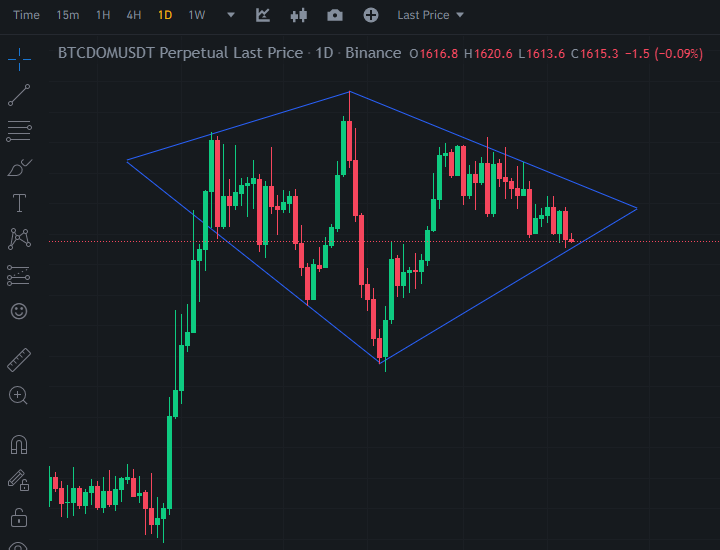
Source: Tradingview